


How well does Australia’s science, research and innovation system perform compared to other developed nations?
The Office of Australia’s Chief Scientist has just released a report addressing this question using data from the OECD Scoreboard on Science, Technology and Innovation. In relation to the highly developed countries the report compares us with, it’s clear we generally perform quite well.
But there are assumptions underlying such comparisons that need to be addressed before we congratulate, criticise or make plans to modify the Australian research and development (R&D) environment.
If we’re serious about examining how our science and research performs, performance measures should provide insight into benefits to the wider community, to the nation as a whole. And it’s not clear how the OECD measures help us do this.
First, some details
The report (Australia’s Position in the World of Science, Technology & Innovation) compares key indicators of Australia’s science and research landscape against those of 12 other countries, each with “a developed economy, an internationally respected research culture and a relatively large research workforce”.
(Australia’s comparison countries are Austria, Belgium, Canada, Denmark, Finland, France, Germany, Ireland, Norway, Sweden, the UK and the US).
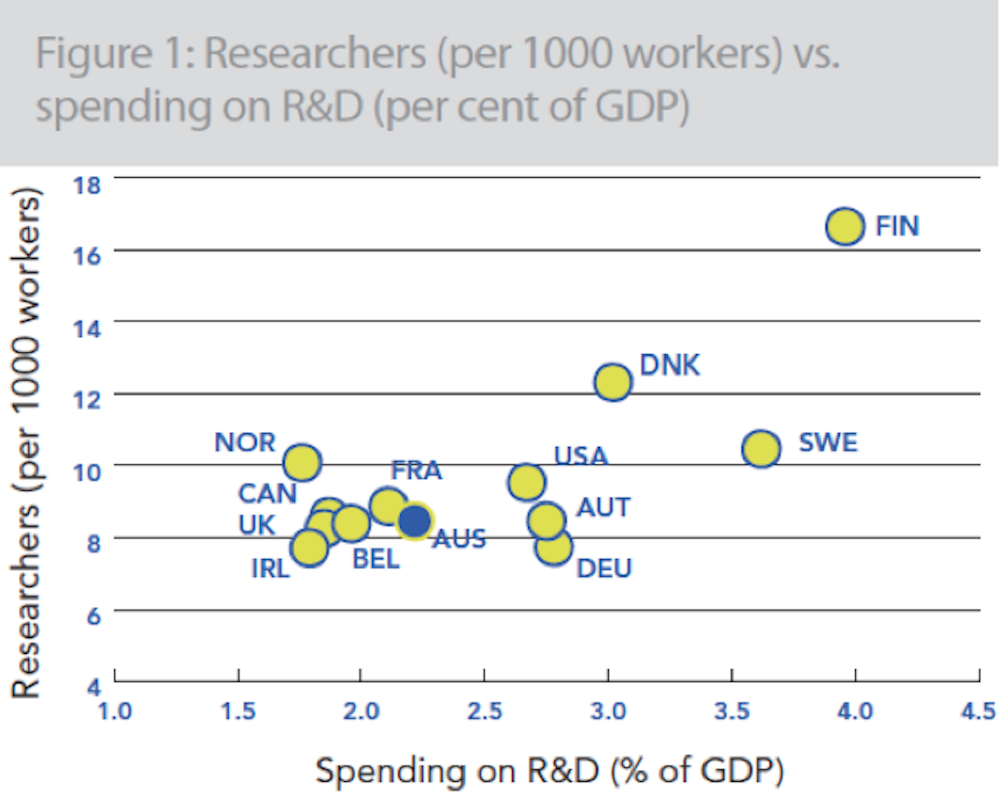
Some of the key findings include that Australia’s R&D workforce parallels most of the other countries (with just over eight in 1,000 workers in R&D), though we are on the lower side in terms of spending, at a little over 2% of GDP. (As mentioned in the new report, this comes even with an increase of some 51% in recent years). On both of these measures, Scandinavian countries are the clear leaders.
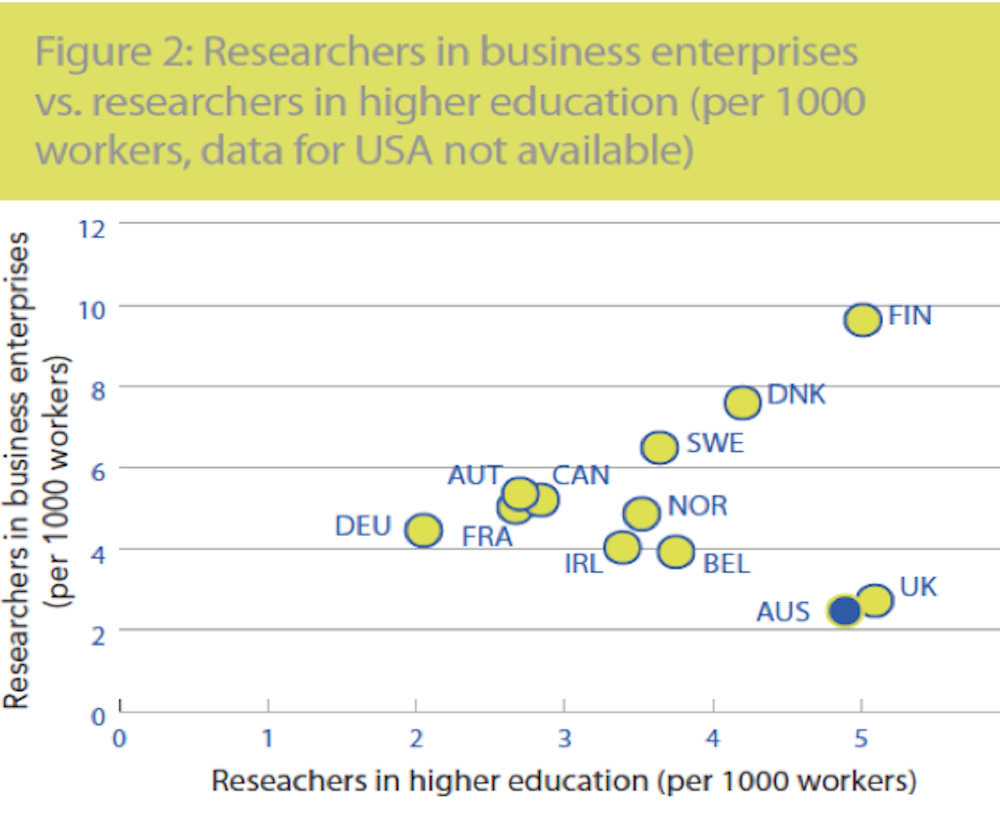
A more interesting metric reveals which sector of the economy those researchers are located in. Of the four main sectors in which R&D takes place (higher education, business, government and private not-for-profit), Australia clearly skews towards employment of our research workforce in higher education.
Nearly five of our eight researchers per 1,000 workers are located in higher education, just over two are located in private businesses. Only the UK shows a similar workforce division.
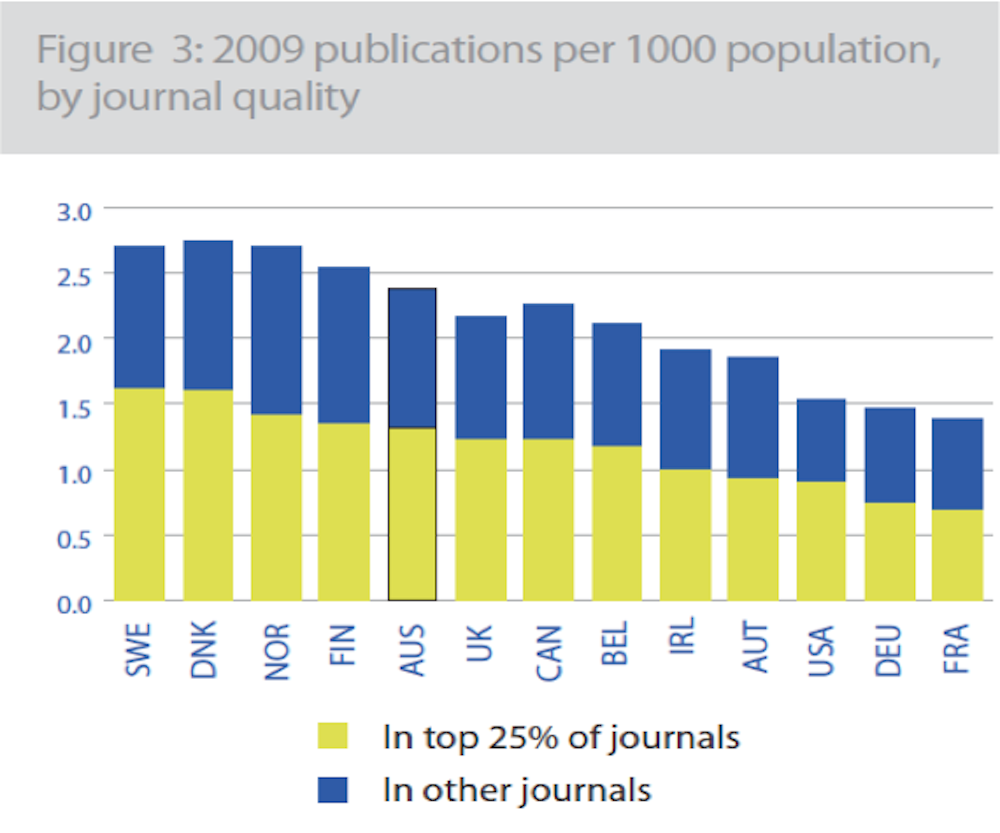
Turning to research outcomes, Australia does well in the number of publications we produce per person, behind only the Scandinavian countries (in this comparison group).
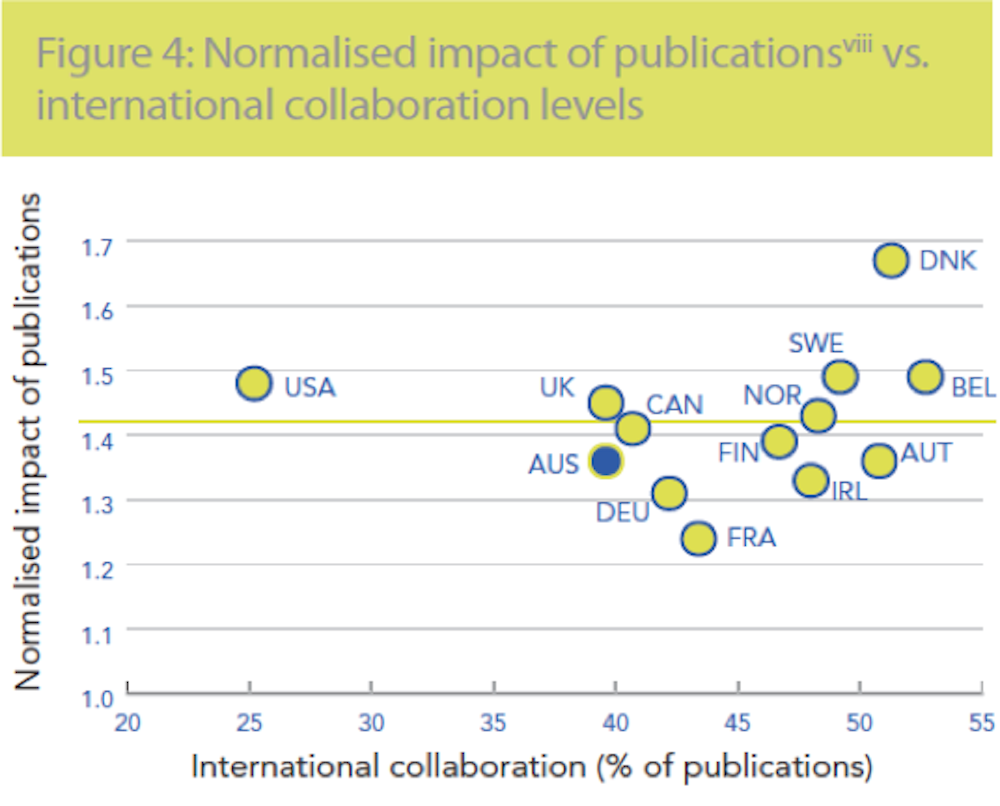
Continuing on this theme, our publications are cited at just a little below the average of the comparison group, yet still well ahead of the global average.
But what does it mean?
It’s interesting - perhaps concerning - that we have fewer researchers employed in business than the comparison countries. But it’s nice to see that our research spend is increasing, too. The fact we are proportionally being published more than many is grand.
But what do these comparisons tell us? Or more importantly, what are we doing this for?
Numbers such as these show Australia to be above, below or on the average compared with a number of leading countries. But what do they say about the effects of R&D in society at large?
Let’s look at “impacts”. Impacts and their quality are inferred using the status of publication venues, numbers of papers, and citation rates by other researchers.
These are essentially R&D “in-house” measures, none of which tell us anything about the broader benefits of that research to the community, or to our quality of life.
Behind metrics like these lurks an implicit intrinsic good argument: more R&D equals good; more researchers equals good; being higher than Country X on publications in high quality journals equals good.
But how is this good, and what is it good for?
We are not arguing there is no value (even if only for national pride) in knowing Australia can punch above its weight on the world research stage. As researchers ourselves, we like that. We also like measures that suggest R&D “needs more” because we work in that space.
But we are also painfully aware that the temptation to believe in the utility of things we’ve measured is strong, even when we know people often only measure the things they find easiest to measure.
We are also aware that comparisons are seductive, even without meaningful – or sometimes any – comparators.
Back to basics
So why might we discuss Australia’s position in the world of science, technology and innovation? Is it simply about trying to score more R&D points than the other guys? If so, that’s OK. (And on that: nice work Oz).
But let’s be careful not to inadvertently use such measures as implicit indicators for tangible effects of R&D on people’s lives. To look more broadly at impact for example, perhaps we should use these OECD data to compare ourselves on broader measures, such as those in the Human Development Index.
Then we could see if having more R&D workers per 1,000 is associated with greater wellbeing across a nation. Only then can we argue for more R&D in the private sector, for example. This would be far more persuasive than “let’s out-publish Finland”.
If we can’t demonstrate that climbing up OECD league tables translates into better national outcomes for all, then we are just another self-interested industry group asking for more.
Further reading:
- Scientific research spending lags behind smaller countries - Justin Norrie, The Conversation