
Two papers released last week in the journal Nature Geoscience provide evidence that warming and melt in West Antarctica are occurring at levels that are highly unusual compared to natural variability.
The West Antarctic Ice Sheet contains about 2.2 million cubic kilometers of ice; enough to raise global sea levels by 3 to 4m. What’s making glaciologists nervous is that the ice rests on bedrock which is below sea level; this makes it vulnerable to attack from below by a warming ocean as well as attack from above by increasing air temperatures. Whether basal and surface melt are currently exceeding natural levels, and the extent and speed at which they could destabilise the entire ice sheet are the subjects of intense research.
Warming up, melting
We already know that West Antarctica is feeling the heat. A study released late last year found that annual temperatures rose by 2.4 ± 1.2°C between 1958 and 2010. It is now ranked as one of the fastest-warming places on earth.
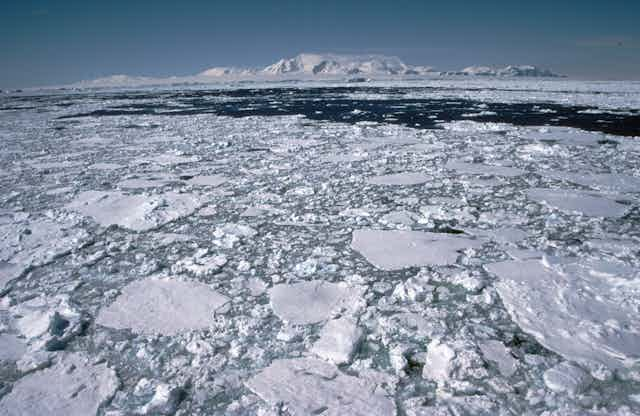
Thanks to satellite monitoring we also know that the ice sheet is losing mass. The weak points are the floating “ice shelves” which fringe the coastline and act like dam walls holding back the flow of ice from further inland. Collapse or thinning of ice shelves causes ice flow from inland to increase, speeding up the discharge of ice into the ocean.
On the Antarctic Peninsula, the northern-most part of Antarctica, widespread thinning and collapse of ice shelves (including “Larsen B”) appears to be driven mainly by melt at the ice surface in summer, causing decay from the top down.
Further south, temperatures remain for the most part too cold to cause significant surface melt. Here, instruments deployed beneath the ice (for example, on the Amundsen Sea coast) indicate that ice shelves are being melted from below by warming ocean waters.
Anthropogenic climate change or natural variability?
Determining the extent to which the rapid changes in West Antarctica are being driven by anthropogenic or natural causes requires a longer term view than the few decades of instrumental observations can provide. This brings us to the two new papers: the first led by Nerilie Abram of Australian National University and the second by Eric Steig of the University of Washington.
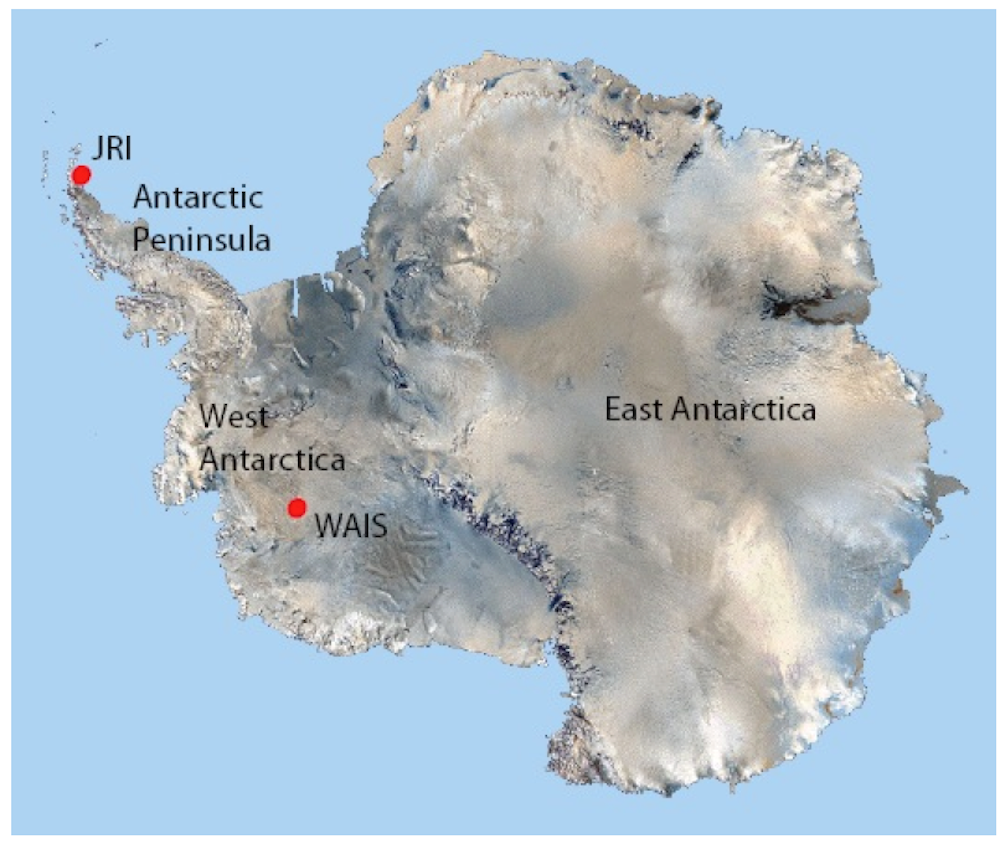
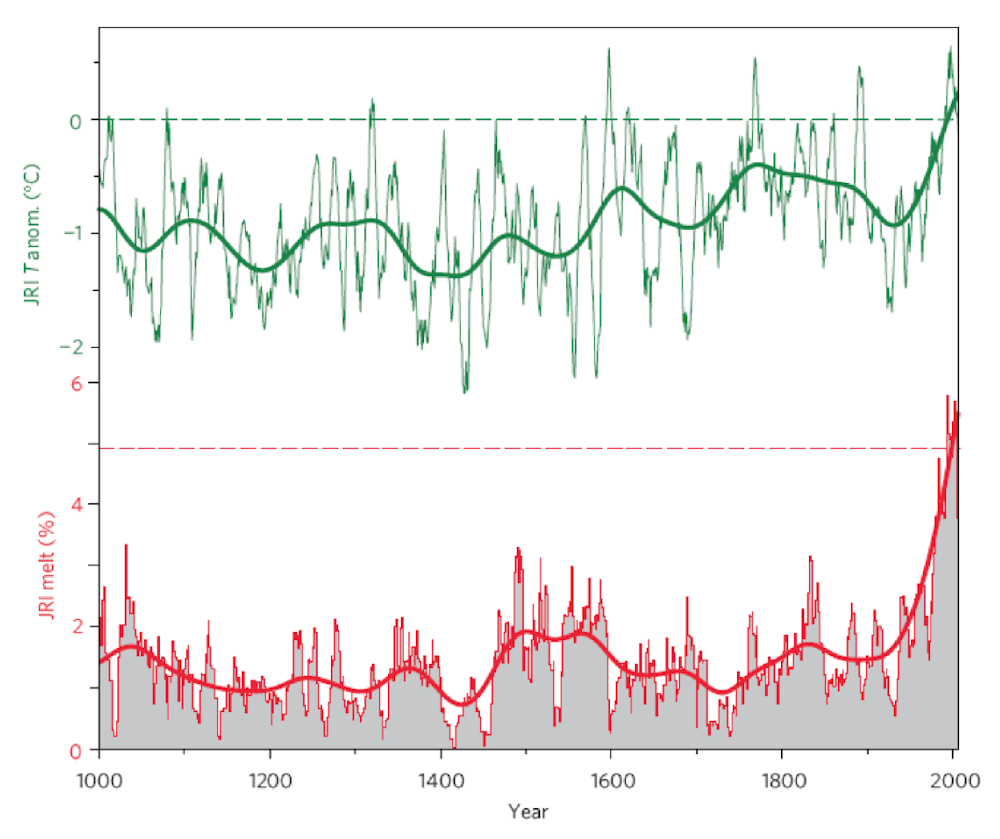
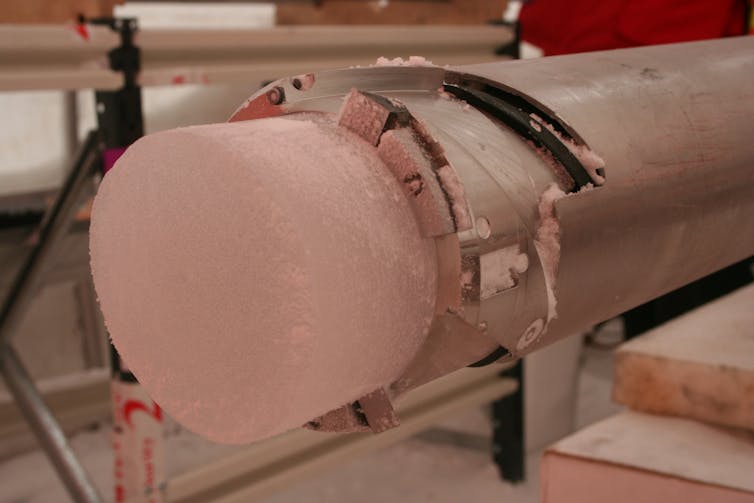
Abram and colleagues focus on a 360-meter ice core from James Ross Island on the Antarctic Peninsula (see map). In one of the first examples of this kind of study in Antarctica they use visible melt layers in the core to reconstruct the history of surface snow melt at the site (see Figure 1, bottom panel). They then compare this record to mean annual temperatures determined using the water isotopes from the core (See Figure 1, top panel).
Their results demonstrate that surface summer melting at James Ross Island is now occurring “at a level that is unprecedented in the past 1,000 years”; indeed, there has been “a nearly-tenfold increase in melt intensity since the late 1400s”.
A concerning aspect of their finding is that the melt rate appears to respond non-linearly to temperature increase. Abram and colleagues explain: “as average summer temperature increases and positive temperature days [days above 0°C] become warmer and more frequent, the amount of melt produced exhibits an exponential increase”. Their conclusion is that ice on the Antarctic Peninsula appears to be crossing a threshold where it is particularly susceptible to rapid increases in melt caused by warming summer temperatures. This could translate to a “poleward extension of areas where glaciers and ice shelves are undergoing decay by atmospheric-driven melting”.
There are similarities and also important differences between these changes on the Antarctic Peninsula and those occurring further south. Eric Steig and colleagues assembled data from a network of 16 ice cores on the West Antarctic Ice Sheet spanning the past 200 years, along with a new record from the central ice divide (the WAIS divide - see map) spanning the past 2,000 years. The paper argues that water isotopes in these cores (namely δ18O - the level of oxygen-18 in the ice with respect to standard ocean water) provides a record of changes in atmospheric circulation that are linked to West Antarctic warming, sea ice retreat and ocean driven melt.
The researchers report that δ18O in the cores increased to levels “probably higher during the 1990s [1991—2000] than at any other time during the past 200 years”, suggesting current warming and melt are equally anomalous. Looking even further back (and accounting for longer term changes linked to ice flow and orbital variations) they conclude that the elevated δ18O of recent decades is not unprecedented “but is near the upper limit of the range of natural variability”; specifically, conditions similar to those of recent decades “occur about 1% of the time over the past 2,000 years”.
Long-distance connections
Some popular media reports have narrowed in on the apparent discrepancy between the two studies: unusual but not unprecedented warming and ocean-driven melt suggested by the cores from central West Antarctica, compared to outright unprecedented surface melt further north on the Antarctic Peninsula. But we would rarely expect climate change in locations separated by more than 2300km (the distance between James Ross Island and the WAIS divide) to unfold identically.
What’s been less reported is that good progress has been made toward explaining why we should in fact expect to see some differences in climate trends between the two locations.
The University of Washington study argues that the warming and circulation changes in West Antarctica are can be traced all the way back to changes in the tropical Pacific Ocean: warming in the Pacific triggers a chain of pressure changes in the upper atmosphere (Rossby waves) that ultimately increases the flow of warm air over West Antarctica.
By contrast, the record melt at James Ross Island appears to be mainly driven by a pronounced southward shift in the strong westerly wind belt that circles Antarctica. This contraction (technically a positive change in the Southern Annular Mode) has a clear human fingerprint. It is linked to the combined influence of increasing greenhouse concentrations and ozone depletion.
To conclude, ice core records now place current warming and melt in West Antarctica at or above the upper bounds of natural variability. The dramatic increase in summer melt on the Peninsula is especially worrying.
Ironically, to better project climate and ice sheet change in West Antarctica we need also improve understanding and projections of climate change in the tropics.