Emissions fell by six times the rate in the five years before the carbon tax than they did under the carbon tax. – Environment minister Greg Hunt, The Guardian, January 17, 2015.
Australia’s total greenhouse emissions have been declining since 2007, the year the Rudd Labor Government was elected.
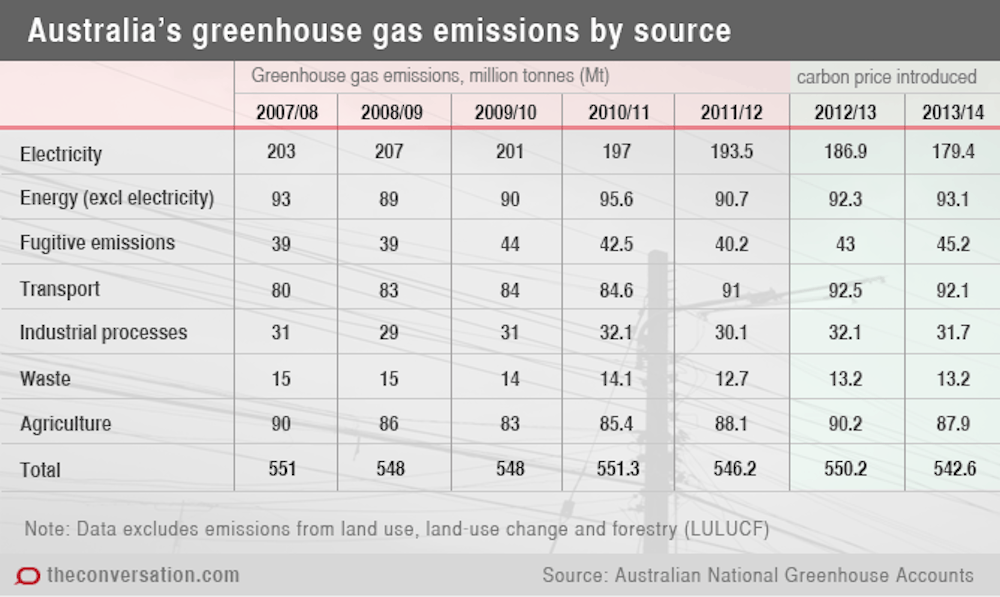
According to data from Australia’s National Greenhouse Gas Inventory, emissions fell, with fluctuations, from 551 million tonnes (Mt) to 546.2 Mt (excluding emissions from forestry) between 2007 and June 2012 – the five years before the carbon “tax” was introduced. This is a drop of 4.8 Mt.
A further decline of 3.6 Mt (from 546.2 Mt to 542.6 Mt) occurred from July 2012, when the carbon price came into force, through to June 2014. So the yearly rate of decline appears to have been greater during these final two years.
Prima facie, therefore, Minister Hunt’s assertion is incorrect if forestry and land use-related emissions are removed (these activities are not directly subject to the carbon price and its influence).
What’s causing emissions to fall?
Aggregated figures provide no insight into the underlying contributions to change in the rate of emissions decline.
Australia’s greenhouse emissions come from several economic sectors, including energy (including electricity production, and emissions arising from the production of other forms of energy, such as the production of coal and liquefied natural gas), transport, agriculture, and industrial processes.
By far the largest contributor to Australia’s emissions is the stationary energy sector (electricity production), which contributed some 33% of total emissions in the year to June 2014.
Changes in emissions from energy production and from transport, and a shift in the sources of energy used for electricity generation, have played the major role in the change in Australia’s aggregate emissions.
During the five years after 2007, emissions from stationary energy declined because of a fall in demand for electricity and a shift in the sources of electricity generation. The decline in emissions from this sector increased from 3.5 Mt in the year to 2011-12 to 6.5 Mt in the year the carbon price was introduced (2012-13). The decline then grew even more, with emissions dropping by 7.6 Mt, the largest annual drop to date, in the following year (2013-14).
This strongly suggests that the carbon price had a direct influence on cutting emissions.
Coal falling, renewables rising
The change in electricity demand may also have been influenced by a contraction in manufacturing activity in response to the effects of the rising Australian dollar.
There was also a significant increase in electricity drawn from renewable sources (particularly solar and wind) and a decline in the cost of its production. Rising electricity prices associated with infrastructural investment by electricity distributors, and then the scare campaign about further electricity price increases associated with emissions trading, also encouraged anticipatory private investment in solar power, and industrial investment in wind power generation. These investments were undertaken and in many cases came online before the carbon price was established in July 2012. The easing of the Millenium drought in 2010 revived the use of hydropower.
In all, the dominance and use of fossil fuels (black and brown coal) for power generation fell from their peak in 2008-09.
However this declining trend in emissions from electricity production was offset by an increase in annual emissions associated with the production of gas and coal for exports (from 39 Mt to 45.2 Mt), and a jump in annual emissions from transport (from 84.6 Mt to 92.1 Mt) over the period 2008-09 to 2013-14.
Verdict
Overall, the promise of an emissions trading scheme and then Australia’s short-lived national carbon price seem to have had a complex but strong and positive influence on Australia’s emissions trajectory that both predates the implementation of price itself and nestles among a range of other factors which are yet to be fully evaluated.
In conclusion, Minister Hunt’s suggestion that the carbon price had little effect on the rate of emissions reduction seems to be incorrect.
Review - Mike Sandiford
The analysis appears to be supported by the data.
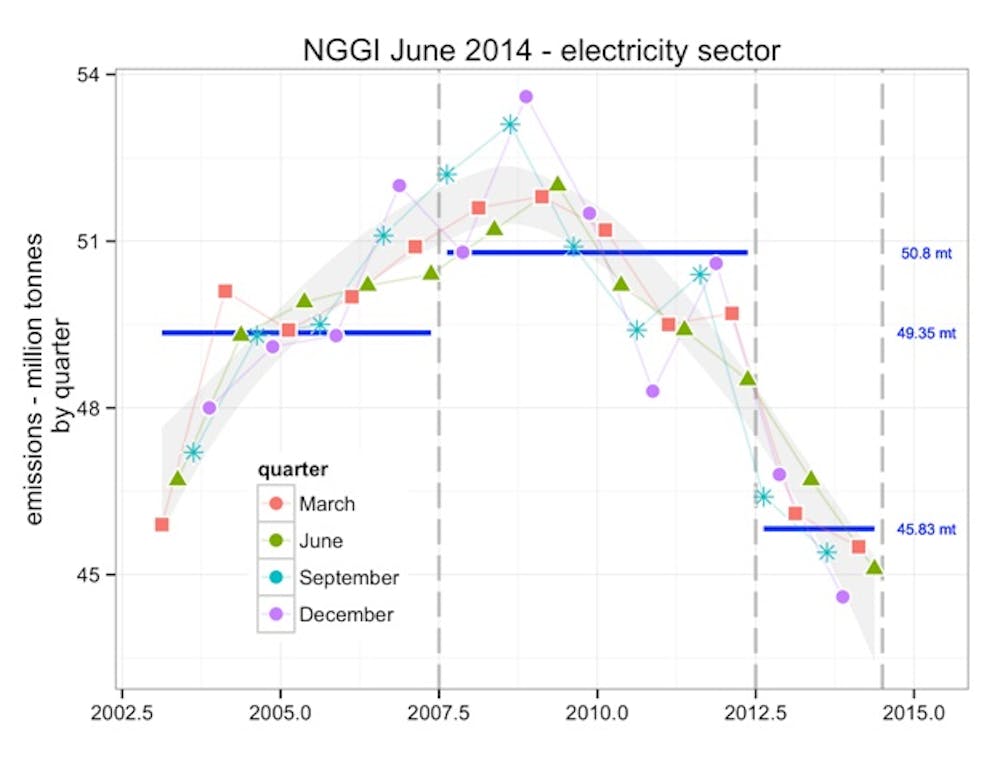
With the minister prone to calling the carbon tax an electricity tax, the electricity sector is the sector to examine. The government’s National Greenhouse Gas Inventory data show electricity emissions averaged 50.8 Mt per quarter in the five years to mid-2012, almost 5 million tonnes more than during the two years of the carbon tax.
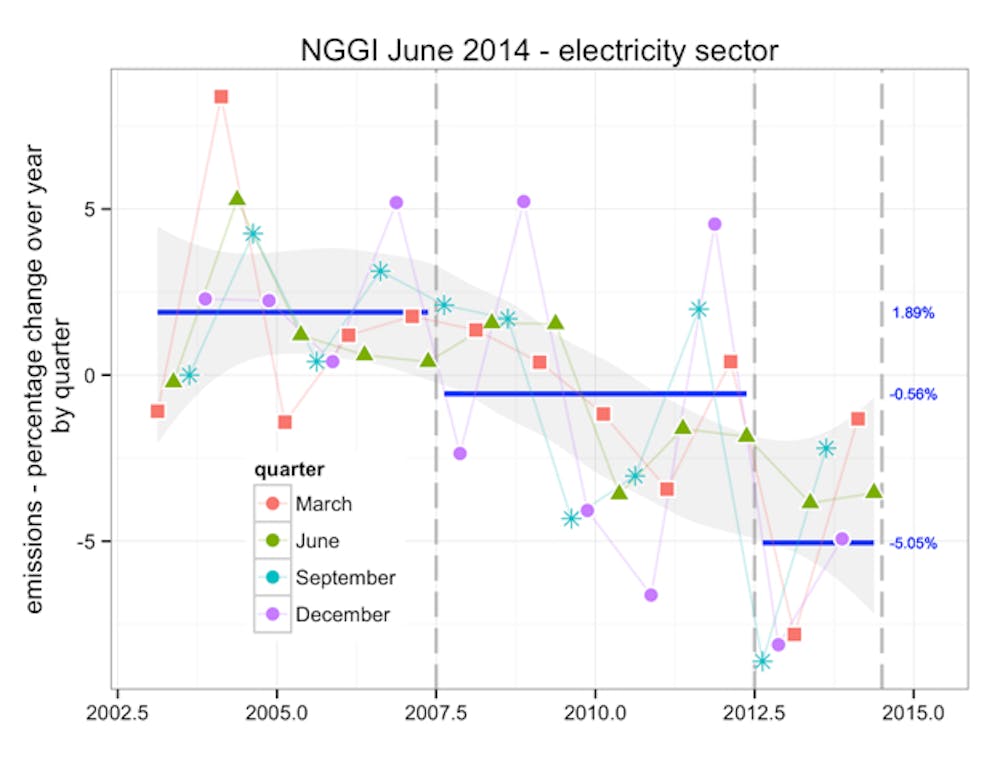
During the five years to mid 2012, emissions declined at an average annual rate of 0.56%. In the two years of the carbon tax, emissions declined at 5%, some nine times faster than during the preceding five years, as you can see in the following charts.