
In relation to this FactCheck on education spending, a spokesperson for the Productivity Commission said (questions from The Conversation are in bold):
Could you please provide sources to support the assertion that there have been substantial increases in spending on education over the past decade?
Real Government spending (combined Australian government and state expenditure, across government and non-government schools) (2013-14 $)
- 2004-05: $40.7 billion
- 2009-10: $45.8 billion
- 2013-14: $50.4 billion
Real Government spending PER STUDENT (combined Australian government and state expenditure, across government and non- government schools) (2013-14 $)
- 2004-05: $12,148
- 2009-10: $13,148
- 2013-14: $13,783
The source is the Steering Committee for the Review of Government Service Provision, Report on Government Services 2016, Productivity Commission, Canberra. (Attachment tables: 4A.7 (total spending) and 4A.17 (per student)
Could you please provide sources to support the assertion that national and international assessments of student achievement in Australia show little improvement?
Page 30 of the Productivity Commission draft report on the National Education Evidence Base notes that:
However, while Australia continues to have a robust education system, there are indications that further work is needed. There has been a 24 per cent real increase in overall government recurrent expenditure on schools between 2004-05 and 2013-14 (almost 14 per cent per student across government and non-government schools) (SCRGSP 2016a). Despite this increase in expenditure, Australia’s performance on national and international student assessments has stalled or, in some cases, declined. Australian students’ mathematical literacy and reading performance, as measured by the Programme for International Student Assessment (PISA), dropped by 29 points and 16 points, respectively, between 2000 and 2012 (Masters 2016). NAPLAN measures of Australian students’ reading and numeracy achievement indicate little improvement between 2008 and 2015 (ACARA 2015d, pp. 258–300). Also of concern are early childhood development metrics that show that one-fifth of Australian children are developmentally vulnerable when they begin full-time schooling (DET 2016h, p. 5).
For NAPLAN (National), ACARA 2015d, National Assessment Program - Literacy and Numeracy: Achievement in Reading, Persuasive Writing, Language Conventions and Numeracy, (accessed 20 June 2016, see pp. 258-300)
Could you please provide sources to support the assertion that some areas standards of achievement have dropped?
Figure 1, from the draft report:
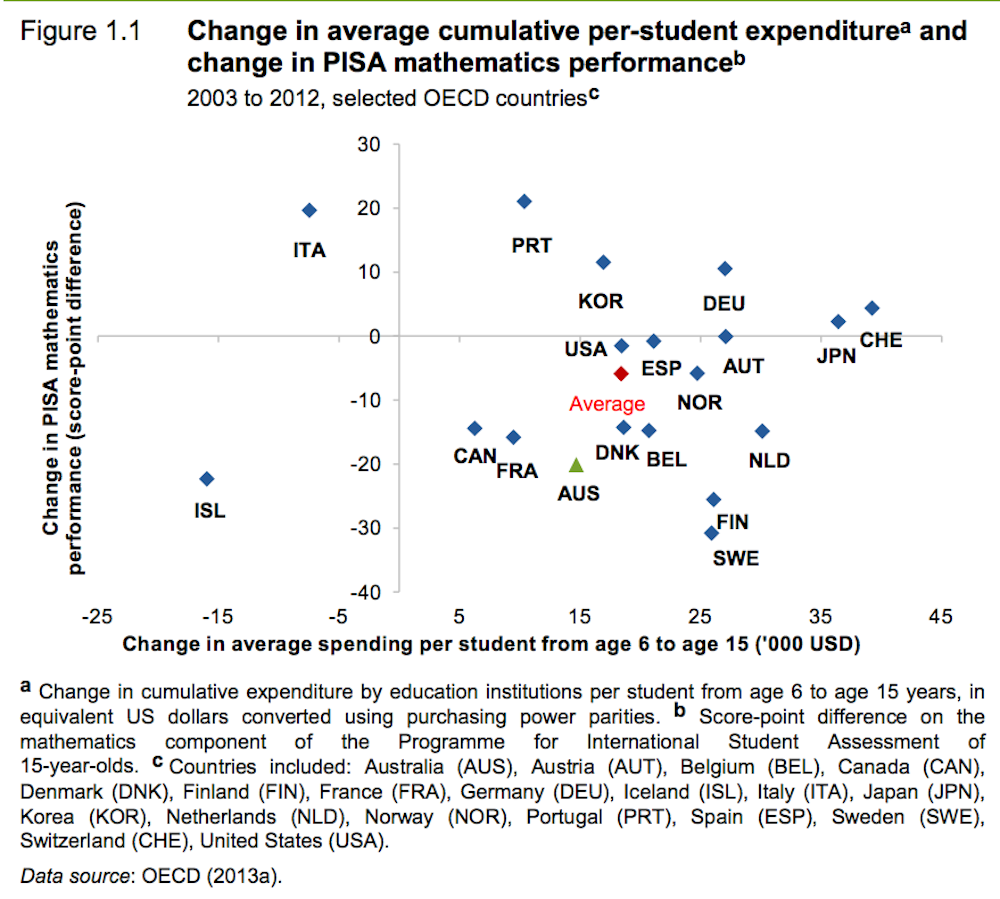
The OECD 2012 PISA report. (The figure comes from Figure IV.1.9 on page 41)
Masters, G.N. 2016, Five Challenges in Australian School Education, 5, Policy Insights, Australian Council for Educational Research, Camberwell, Vic, (accessed 25 July 2016).