


The role grammar schools should play in English education is still hotly contested, more so today than it has been in years. This is despite the fact that there are only 164 grammar schools operating in England today (out of more than 3,000 state secondary schools), a huge decline from their sixties heyday.
Part of the reason for the heat in the debate is the proposal from some on the right of British politics that grammar schools should be fully revived as a way to boost social mobility. Our recent research on the grammar school system re-ignited this debate, with both pro- and anti-grammar commentators claiming support from it for their position.
But by leaving aside the obvious questions – whether access to grammar schools is fair (no) and what grammar schools can do for marginal students (open to debate) – we can avoid the more overheated parts of the debate, and instead address a trickier problem: the implications selective school systems might have for longer-term earnings inequality.
Like with like
We did this by using a nationally representative data source, Understanding Society 2009-2012. For our study, we considered the adult earnings distribution for over 2500 individuals born between 1961 and 1983, comparing those who grew up in selective-school areas with those who grew up in comprehensive-schooling systems.
We matched comprehensive-schooling areas to selective-school areas based on average hourly wage, unemployment rate, and the proportion of private schools in each area. The data also allowed us to control for parental education and occupation when an individual was 14, gender, age, ethnicity and current area of residence.
After introducing these controls, we were able to compare the adult earnings of people who look very similar – except that some grew up in an area operating a selective system and others in one with a comprehensive system.
The spread
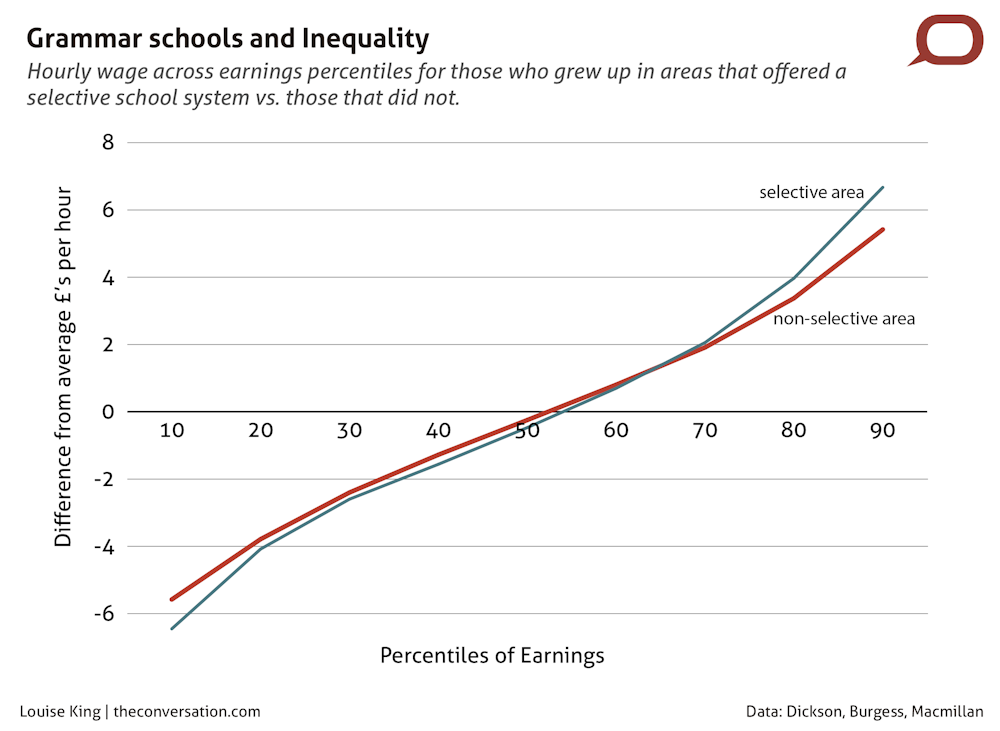
When we considered these two groups, we saw that average earnings in each group were very similar: almost exactly £8.60 per hour. Earnings inequality however was greater for those who grew up in areas operating a selective system compared to those who grew up in comprehensive areas.
One way to compare the degree of inequality in each distribution is to look at the standard deviation, which captures how widely spread earnings are around their average level. Comparing individuals with similar characteristics, the standard deviation of earnings for those who grew up in selective areas was £5.41 per hour – substantially higher than the £4.81 deviation in non-selective areas.
Another way to quantify the inequality is to look at the difference in pay between those at the 90th percentile of the wage distribution and those at the 10th percentile. For those who grew up in a selective system, this figure is £13.14 an hour, whereas it’s £10.93 an hour for the comprehensive system.
This means that those who grew up in the selective system and go on to be top earners take home £24,000 more per year than those at the bottom of the distribution, whereas for people growing up in the comprehensive system the corresponding difference is just under £20,000.
Those comparisons look at the difference between the top and the bottom of each distribution, but we can also compare the top of the selective system distribution and the top of the comprehensive distribution. What we found was that those who grew up in a selective system and ended up earning at the 90th percentile earned £1.31 an hour more (statistically significant) than comparable individuals who grew up in a comprehensive system. At the other end of the scale, if you grow up in a selective system and don’t do so well, earning at the 10th percentile, you earn 90p an hour less than the similar individual who also grew up in a comprehensive system – a statistically significant gap.
These patterns are illustrated in the chart below. Notice how those at the top do relatively better in the grammar system, while those at the bottom do worse. These differences are statistically significant. We can also see that it is not until the 70th percentile that the selective earnings distribution climbs above the non-selective one.
Still dreaming
It seems clear that grammar systems increase inequality, lowering earnings at the bottom as well as raising them at the top. So why do some still champion them as a surefire way to boost social mobility?
The reason is well illustrated by Toby Young’s glib response to our research. Social mobility arguments for grammar schools focus exclusively on the impact they have on the top of the earnings distribution for the 25-30% of children who make it into one. The impact there is indeed positive, and our research does show that: those at the top who come from the grammar system do earn more.
The argument then runs that grammar schools promote social mobility by enabling bright kids from poorer backgrounds to access these schools and go on to achieve high earnings and status.
But what we have shown is that there is another side to this story – what the selective system does to those at the bottom of the distribution. At that end, individuals who do not make it to the grammar school do worse than they would have done if they had grown up in an area with a comprehensive school system.
We might also refer to the evidence that selective systems sort children more by where they are from than by ability – and soon, it becomes clear that selective systems are not the social mobility boosters that their champions claim them to be.
A select few individuals from poorer backgrounds do benefit from the grammar system, but the vast majority will not go to a grammar school, and are therefore more likely to end up lower down the earnings distribution than if they grew up in an area operating a comprehensive system.
The debate about grammar schools will no doubt continue to rage – but what we cannot ignore is that selective schooling systems have consequences for those who don’t get in as well as those who do.
Hard Evidence is a series of articles in which academics use research evidence to tackle the trickiest public policy questions.