

European cultural and creative cities have stronger economic output and more jobs than their Australian counterparts. So why is our urban creative vibrancy associated with city size, not economic performance?
Culture nurtures our souls and binds our communities together, while creativity helps reveal new answers to our challenges and anxieties. Industries that build on creativity and culture are also a source of great economic value and social well-being.
So opens the latest European Union report, The Cultural and Creative Cities Monitor 2017 Edition. The report and supporting data represent an effort to measure something we all know is important – the creative vibe of cities.
Creativity is making its way more and more into policy discussions. Note the European policy announced last year, Towards an EU Strategy for International Cultural Resolutions, and the European Parliament’s resolution to deliver “coherent EU policy for cultural and creative industries”.
Australia lacks a current national cultural and creative industries policy. There are clear parallels, though, with the national Global Innovation Strategy. Other innovation and creative programs are happening at state level, such as Innovate Queensland.
The European work shows that having cultural and creative cities can deliver significant economic benefits. The positive associations between cultural and creative cities and annual GDP per capita and jobs per capita are clear and strong.
Overall, they also found city size isn’t everything: smaller cities perform just as well as big cities.
How do the biggest 36 Australian cities compare?
We don’t have the data to construct the same metrics as the EU. However, based on the publicly available data from the Regional Australia Institute, we use the Bohemian Index as a proxy indicator for creative economy.
This index, devised by Richard Florida, measures “the concentration of working artists, musicians, writers, designers, and entertainers across metropolitan areas”.
Australian findings show no association between creatives and city output, measured as gross value added (GVA) per capita. There is only a slight positive relationship between jobs and creativity, as shown below. In contrast, the European Creative and Cultural Cities Index is highly and positively correlated to both GDP and jobs per capita.
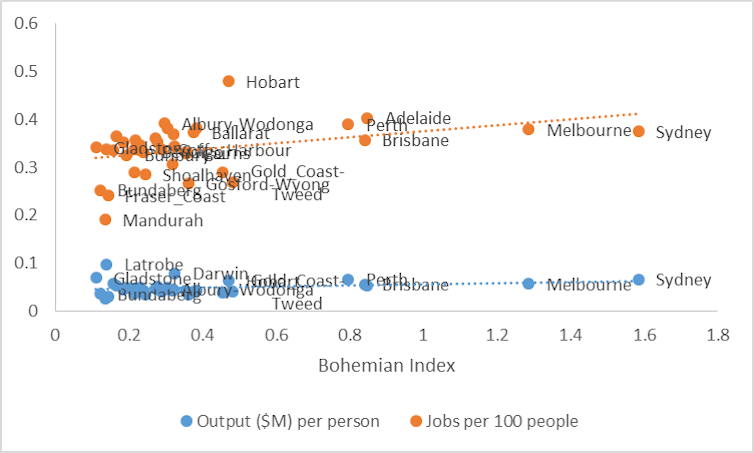
As we can see, there is a positive relationship between Australian city size and creative employment. This is the opposite of what the Europeans found.
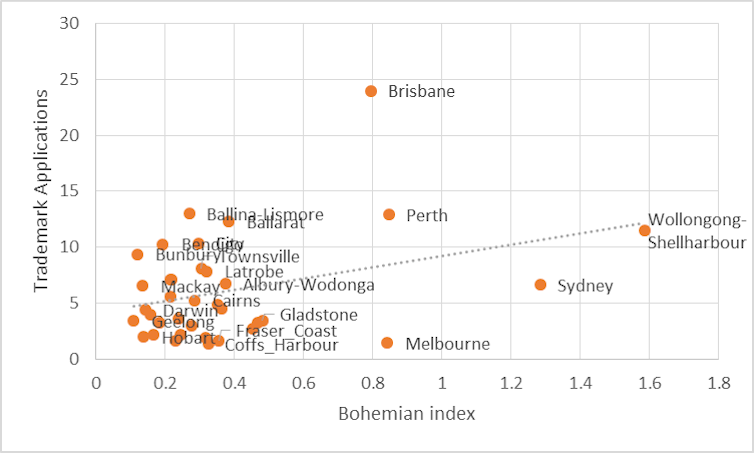
So what do Australia cities share with European cities in the way of creative economy and economic performance? Basically, there is a positive and strong correlation between a city’s Bohemian Index and new business start-up rate, trademark rate (see Figure 2) and rate of business owners.
Creativity also has significant positive associations with higher rates of bachelor degree qualifications or higher, housing affordability and commute time.
Disturbingly for Australia, creativity is positively associated with income inequality (measured as 80:20 ratio) as well. Does this mean that our cities with more creative jobs also have more rich patrons and poor arts students?
Importantly, not all cities perform the same. Our 31 regional cities show a significant and negative relationship between unemployment rates and Bohemian Index. Maybe the metro “Big 5” can learn from our regional city strengths in delivering stronger creativity and lower unemployment.
What can Australia learn from Europe?
Creative and cultural cities are obviously valued as important for global society, but European research clearly shows that these cities are also capable of delivering jobs and strong economic output.
Do we want all Australian cities to resemble Gladstone, with its high jobs and output, or Hobart, with its strong creative occupations? The Europeans have shown us we can have both in the one city – and not just in the big cities.
Importantly, if Australia follows a policy-transfer approach to creative and cultural cities, we should be cautious. These policies are also promoting economic performance in Europe, but what will they do here when we don’t see the same relationships?
While the latest EU work shows you can measure the cultural and creative aspects of a city, it does stipulate that this is not a be-all-and-end-all metric. It’s more the start of the discussion: how can we better measure our cities’ creativity and cultural values?
Europe uses three metrics (combining quantitative and qualitative data) to gauge a city’s cultural vibrancy, creative economy and enabling culture environment. The work is long and involved. Cities are required to provide information on 29 indicators – number of seats in a theatre, for instance.
We have just used one metric here, perhaps highlighting that poor data hinders good decision-making. A better measure of creative and cultural Australian cities could have provided different associations.
Australia is the “lucky country”, so why can’t we have it all – jobs and creativity in all our cities?