


Polling organisation YouGov has caused a stir with its latest findings, which appear to defy practically everyone else’s 2017 general election forecasts.
Analysis of its survey data suggested Theresa May’s Conservative Party would lose its majority if the election had been held on May 31. According to its findings, the Tories were ahead in 311 seats – 19 fewer than they won in 2015 and 15 short of the 326 needed to secure a majority in parliament.
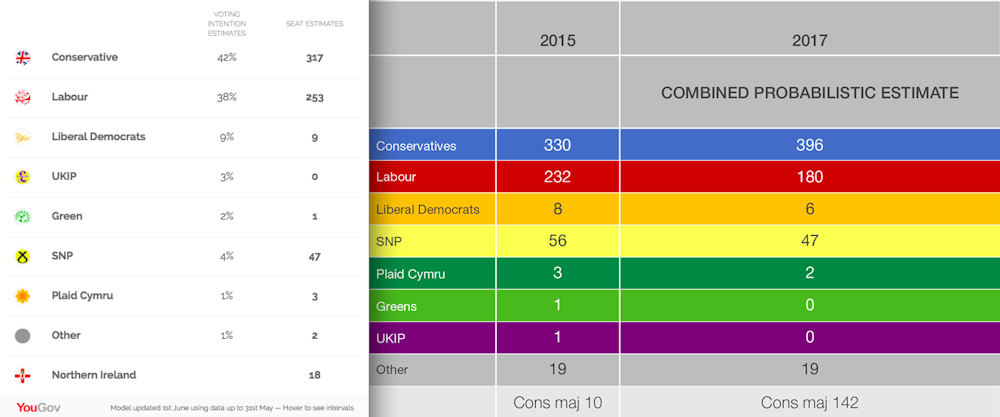
Interestingly, YouGov’s overall estimates for the Tories are 85 seats below another major pollster, Michael Ashcroft. So what happened? How could one forecast show the Tories losing their majority, while another pollster shows May’s party sailing to an easy victory? Are we headed for another polling fiasco?
To answer this question, we examined the polling methodologies used by YouGov and Ashcroft.
YouGov polls approximately 7,000 respondents daily – nearly 50,000 per week – about their voting intentions for the 2017 general election. Given that there are 650 constituencies within the UK (although they rarely poll in Northern Ireland’s 18 seats), this means that each week there are roughly 75 respondents within each constituency from which to draw inferences. Ashcroft, meanwhile, uses the responses from 40,000 respondents each week to estimate his seat projections.
Both pollsters use large sample sizes with decent coverage in every constituency, which means that it is possible to project seat-by-seat winners. Constituency-level estimates are essential for forecasting a multi-party election because national polls only give us a sense of what the overall vote share will be, not which candidate will win in a multiparty competition within 650 different constituencies. Accurately predicting this is no mean feat.
In contrast, most national polls (with sample sizes nearer 1,200 respondents) simply do not have enough respondents in each constituency to create reliable estimates. That being said, a sub-sample of 75 greatly increases the margin of sampling error (MoSE), or the uncertainty surrounding the polling estimates. While a sample of 50,000 has a very small MoSE – only +/-1% (for the typical 95% level of confidence) – a 75-person constituency sub-sample has a considerably higher degree of uncertainty: +/- 12%. To see this for yourself, try this MoSE calculator.
To correct for this high degree of uncertainty, YouGov and Ashcroft use Multilevel Regression and Post-stratification, or MRP (“Mister P”) for short. The “special sauce” behind Mister P is a sophisticated method for combining known demographic proportions (based on gender, age, education, etc. from the Census) with the survey responses to create constituency-level estimates. In theory, this should provide marked improvements in the forecasts because it weights polling results with known Census demographics to adjust the final estimates.

Despite the sophisticated methodology, the main drawback faced by YouGov, Ashcroft, and other UK pollsters is their recruitment strategy: pollsters generally recruit potential respondents via self-selected internet panels. The American Association of Public Opinion Research cautions that pollsters should avoid gathering panels like this because they can be unrepresentative of the electorate as a whole. The British Polling Council’s inquiry into the industry’s 2015 failings raised similar concerns. Trying to deal with these sample biases is one of the motivations behind YouGov and Ashcroft’s adoption of the modelling strategies discussed above.
The devil in the detail
But we should still be cautious. In fact, no amount of post-stratification weighting or survey raking can fully correct for the inherent problems of self-selection in non-representative samples. And there’s good reason to believe that the voting intentions of YouGov participants are different to the majority of people who choose not to participate.
What are the clues that the projections might be wrong? If you dig into the YouGov predictions, we find some really odd projections. Take, for instance, Cities of London & Westminster constituency. There, a 27% point Conservative lead over Labour in 2015 (Con 54%, Lab 27%) becomes a narrow Con-Lab marginal in the YouGov model (central prediction: Con 40% Lab 37%).
Or look over to Battersea, which was a 16% point Conservative lead in 2015, and now is projected as a 3% point lead for Labour. But Waveney, marginal in 2015, now shows an unchanged Conservative lead of 5% points.
In short, weighting will almost certainly be better than making inferences based on the raw, unadjusted samples, and the Mister P method is as sophisticated as it gets. Yet, the underlying problem is one of sample representativeness – that is, making sure that survey respondents reflect the views and opinions of those of the general population in each constituency as well as across Britain as a whole. Without that, it doesn’t matter how large the sample size is.
Just recall The Literary Digest’s famously wrong prediction in 1936 that Alf Landon (who?) would defeat Franklin D Roosevelt in a landslide based on 2.4m responses. Unfortunately, the only way to really know if the weights are correct is to wait until after the election. Good thing it’s only days away.