
The state of the earth’s biodiversity – the world’s variety of living organisms – is in crisis. About one third of the world’s land has been severely degraded from its natural state. Some of the worst forms of degradation include deforestation, soil erosion, loss of soil fertility, declining water quality and pollution.
This has a huge negative impact on poor rural people whose livelihoods depend heavily on natural resources, like pastoralist communities and smallholder farmers. Land degradation is also devastating for land animals – in about 40 years vertebrate species populations have dropped by more than half.
This crisis has attracted international attention, and efforts to restore degraded lands are underway. For instance, the Bonn Challenge commits countries to the ambitious task of restoring 350 million hectares of degraded lands by 2030. African nations committed to 100 million hectares. This entails the enormous task of planting trees and ground cover and restoring soil fertility – all actions which also help increase the soil’s ability to absorb water and reduce erosion.
But with such large areas in need of restoration, and the persistent problem of limited resources, how and where should efforts be deployed?
In our recent publication we show how the Land Degradation Surveillance Framework could solve this problem by systematically measuring and tracking indicators of land health. It includes very precise maps, which show how degraded land is, and how well it can recover. This helps to prioritise land restoration over huge areas. It’s already being applied to restore degraded lands in many parts of the world including East Africa, the Sahel, the Peruvian Amazon and India.
Our study focused on the drylands of Kenya, where the framework is being used. We found that key indicators of land and soil health vary. This meant that consistent and robust monitoring methods are needed to prioritise and inform investments. Specifically, indicators that are science based, can be measured, are fast, based on varying scales (plot, field, landscape, region) and are representative of the complex processes of land degradation in landscapes.
The Land Degradation Surveillance Framework ticked all of these boxes.
Testing in Kenya
To start with, field data is systematically collected to provide a baseline for biophysical properties like; soil fertility, soil organic carbon, vegetation cover and biodiversity, land use and land degradation. The field data is combined with data from earth observation platforms – like NASA’s Landsat and the European Space Agency’s Sentinel 1 & 2 which create images from satellites – to map processes of land degradation.
We then apply these maps to assess the effectiveness of rehabilitation options like tree planting, improved rangeland management, agroforestry practices and erosion control.
By providing information on indicators of land degradation – like soil erosion – in the form of maps, it helps to target rehabilitation efforts. It will show how degraded the land is, and how well it can recover.
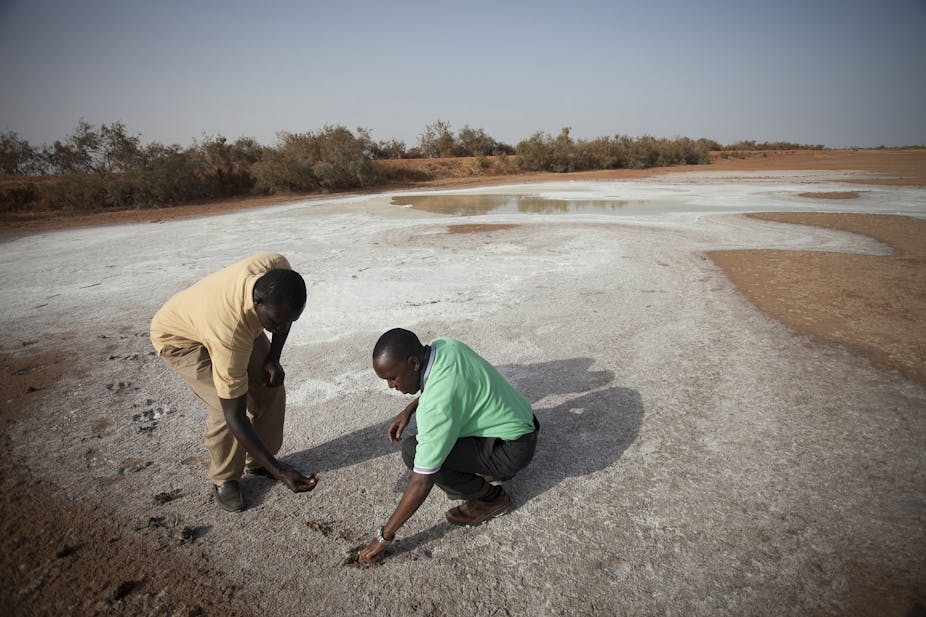
We used the 200 square kilometre Mpala Research Centre in Laikipia County, Kenya, as a test case. This was done to compare plots to each other, assess the level of degradation in each and to create maps of it.
Over a month we took soil samples, described and measured vegetation and recorded erosion levels from 160 plots within a 100 square kilometre area. These were taken to labs in Nairobi to analyse the soil’s physical and chemical soil properties.
For a portion of the samples, we did conventional soil chemical analysis and combined these data with results from spectroscopy – which uses infrared light to analyse for multiple soil properties. This gave us an indication of soil health in the study area as it examines the soil organic carbon, sand content, and pH.
Finally, using these data we created predictive maps of soil characteristics and land degradation. This provides a clear visualisation of the areas in most need of attention, for instance where erosion is high and soil organic carbon, an important indicator of land health, is low. We also used a combination of predictive maps to identify the areas with the greatest chances for successful habitat restoration, and to get a sense of the urgency and level of effort required for restoration on Mpala.

The approach is innovative on several levels:
First, by using mid-infrared spectroscopy we significantly reduce the time and cost of analysing soils
Second, the highly precise models used to predict soil characteristics allows us to take enough soil samples to accurately account for variation across the landscape
Third, by integrating all the data we were able to expand the scale of our projections and mapping to the landscape and regional levels.
Although we only mapped a 200 km2 land area, the approach has the potential for mapping land rehabilitation needs for much larger areas. This will assist national and regional level decision makers on how to invest scarce funds to restore productivity to the land, and help bend the trajectory of declining nature.
Margaret F. Kinnaird, Practice leader, Wildlife at WWF International and Timothy G. O’Brien, Senior Scientist, Conservation Measures at Wildlife Conservation Society, contributed to the writing of this article.