
The Conservative Party manifesto commits to cut total public spending in real terms by 1% a year in 2016–17 and 2017–18. It implies this is easy. It “means saving £1 a year in every £100 that government spends”. Spending is then to be frozen in real terms in 2018–19. If delivered this would, on the latest official forecasts, be sufficient to meet the commitment to eliminate the deficit in 2018–19, without having to announce significant further tax rises. So far, so simple.
But as the OECD has suggested this week, meeting these spending plans will be anything but easy, as I set out on Thursday in a presentation at a pre-budget briefing organised jointly with the Institute for Government.
Going deep
The reason is that keeping to these, perhaps seemingly benign, spending totals will actually require deep cuts to some areas of government. This is because underlying pressures are increasing spending in other areas. Debt interest spending is forecast to rise as both government debt and the effective interest rate on that debt rises.
Spending on public service pensions is forecast to rise as the numbers receiving such pensions grows. Spending on state pensions is forecast to increase as average state pension payments continues to rise. In addition commitments to increase spending in some areas, and not to cut other areas, increases the size of the cuts required elsewhere.
One area where the Conservatives’ manifesto commits to make cuts is in social security spending (outside of protected spending on state pensions and universal pensioner benefits). But, as this IFS observation published last week points out, finding the sought after £12 billion of cuts in just two years will not be easy. Cuts of this scale amount to almost 10% of unprotected benefits. Finding such a reduction without cutting child benefit, which has been pledged this week, would mean that even more significant cuts would likely be required to spending on one or more of tax credits, housing benefit and disability & incapacity benefits.
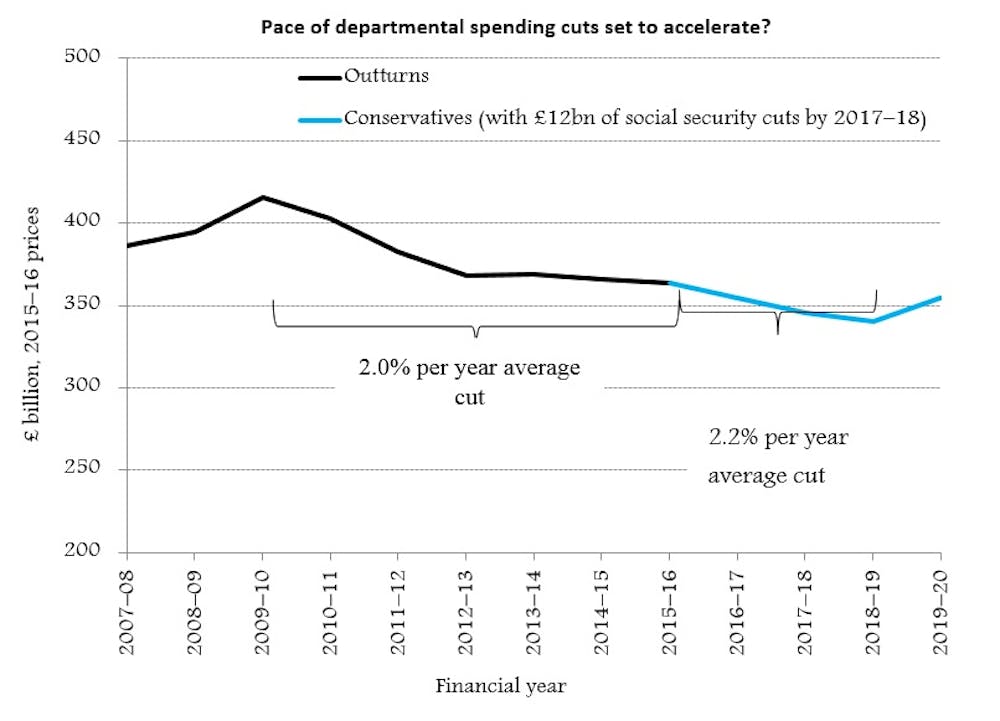
But to meet its overall spending target, even delivering the £12 billion of cuts to social security spending would still leave the government needing a slight acceleration of cuts to departmental spending, compared to what we have seen since 2010–11. As shown in the chart below, the cuts would need to increase from the 2.0% per year seen over the five years from 2010–11 to 2015–16, to 2.2% per year over the three years from 2015–16 to 2018–19.
This would give a total cut of £23.8 billion across all departments between 2015–16 and 2018–19. That’s on top of the £2.2 billion of cuts taking place in 2015–16 and the £49.2 billion of cuts delivered between 2009–10 and 2014–15.
Protection racket
These cuts in departmental spending are to be far from evenly spread. Spending on overseas aid and the NHS is set to continue increasing in real terms, while schools’ spending per pupil is to be protected in cash terms. As we set out in our analysis of the main parties’ manifestos prior to the general election, this requires cuts elsewhere averaging 15.3% (or £30 billion) over the three years between 2015–16 and 2018–19.
In other words two years of overall spending being cut by 1% a year, followed by a year in which overall spending is frozen, quickly becomes a 5.4% a year cut, for three years, for a swath of public services. That would see a cumulative cut to these other unprotected departments over the eight years from 2010–11 of 32.9%.

These unprotected areas include spending by the Ministry of Defence, the Home Office, the Ministry of Justice, the Department for Communities and Local Government, the Department for Business, Innovation & Skills, and the Department for Transport. Protecting defence from any further real cuts – which would still leave its budget falling further as a share of national income – would increase the cuts elsewhere over the next three years to 18.7%, and the cuts over the eight years from 2010–11 to 36.9%.
That is not to say that such spending cuts would prove impossible to deliver. The coalition government was successful in keeping (broadly) to the spending plans set out in 2010. However it was helped by lower-than-forecast nominal growth in private sector wages, which made it easier (at least economically) to constrain the public sector pay bill.
New commitments
There are further reasons to think the next phase of cuts will be harder to deliver than those achieved since 2010. Presumably, efficiencies that were easy to identify and to deliver have already been made. Similarly, programmes judged to be low value have already been scrapped. And, from next April, public sector employers will find the cost of offering their staff public service pensions rises as reduced National Insurance payments for contracting out end (£3.3 billion) and new scheme valuations push up the required employer contribution rate (£1.1 billion).
On top of this, new spending commitments – such as the extension of free childcare (costed by the Conservatives at £350m), the new tax-free childcare scheme (£800m), the removal of the cap on HE student numbers (£800m) and the Dilnot social care funding reforms (£1.0 billion) – will further increase the cuts required elsewhere. Meanwhile demand for some public services – including social care – continues to rise as the population grows, and ages.
The cuts that the government announces later this year, in next month’s budget and the following spending review, may turn out to be deliverable. But they certainly will not feel like just 1% being taken out of each area of spending, nor will it require merely “£13 billion from departmental savings” as the Conservative manifesto described.
While not inaccurate, these numbers give a misleading impression of what departmental spending in many areas will look like if the manifesto commitment to eliminate the deficit by 2018–19, largely through spending cuts, while not cutting spending in many areas, is to be met.