


Income inequality is undoubtedly one of the most controversial economic issues of modern societies, with many countries facing incredible differences between those who make more and those who make less. But what is happening across Australian regions?
Although researchers such as Peter Whiteford and Nicholas Biddle have investigated the issue in Australia, there are no official records on income inequality measured consistently across regions of the country – even at national level income inequality measures are rarely available in international comparisons (see for instance, World Bank and OECD data.
This lack of evidence is a clear reflection that income inequality is less conflicted in Australia compared to other countries, as Australia is characterised as having very low rates of poverty and economic segregation, compared to other societies, and a culture of “a fair go”.
However, regardless of the apparent “economic equality” in our society, income inequality is still an important issue to track and analyse. In order to fill the gap on income inequality measures across the country, we have developed a method to approximate Gini coefficients for different Australian regions, including states and local councils.
What we found
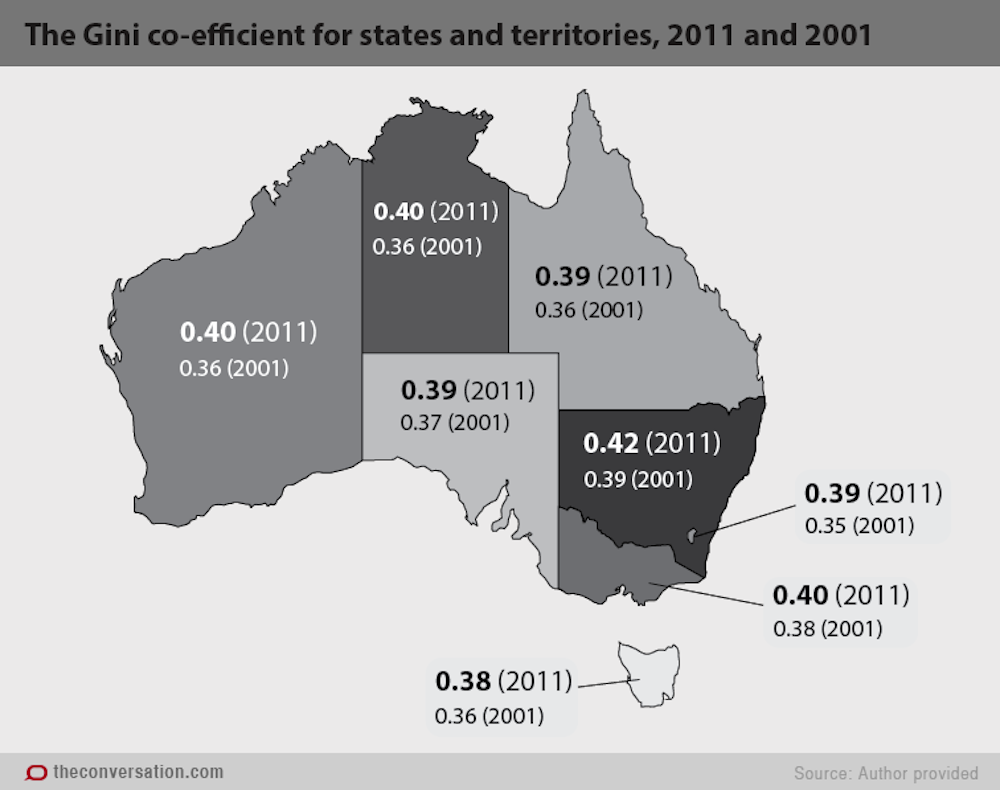
At state level, based on our estimates in 2011, the most unequal jurisdiction was NSW (0.42), followed by the Northern Territory (0.40), while the least unequal was Tasmania (0.38), meaning that the gap between the rich and the poor was bigger in NSW than in Tasmania.
However, income distribution varies over time, with the ACT showing the biggest change in income inequality, where the Gini coefficient increased from 0.35 in 2001 to 0.39 in 2011.
At sub-state level, within metropolitan areas, we found that the local councils of Burwood, Strathfield, Kogarah and Sydney (all from the Sydney Metropolitan area) had the highest income inequality in the country in 2011, while the local councils of Melton (in Melbourne), Light (in Brisbane), Mallala (in Adelaide) and Palmerstone (in Darwin) had the lowest income inequality.
In terms of trends in cities, interestingly Perth captured both extremes: while the suburbs of Cottesloe and Subiaco is where income inequality has increased the most, the local council of Perth had the lowest increase in inequality across Australian cities.
Using the Gini co-efficient
The Gini is one of the most used indicators for income inequality across the world for its simplicity: a Gini of 0 means that the total income of the region is distributed evenly across all persons of the region, while a Gini of 1 means all income captured by just one person. According to the OECD, in 2012 Australia had a Gini of 0.326, while the US had a Gini of 0.390.
Thus, in order to provide more insights about the effects of the mining boom of the recent decade across Australian regions, we have constructed Gini coefficients for family income reported in the national censuses of 2001 and 2011, across all regions of the country (see our published paper here.
Although our measures are not perfect and are subject to some assumptions, including the assumption that 30% of families in the richest income bracket capture 70% of the income in that segment (see the assumptions used and estimation steps here), they do provide a good sign of how income inequality varies across the country and how it has been changing over time.
All Gini coefficients across regions are available here.
Policy implications
These income inequality data raise several questions. Are the reasons for income inequality different around the country? Does income inequality affect other factors such as health, as evidenced in the US?
What levels of income inequality are acceptable across Australian regions? And what actions are required to address this? These are the questions policy makers should now tackle.