
A new statistical snapshot paints a fascinating picture of wealth in Australia.
According to the Household, Income and Labour Dynamics in Australia (HILDA) Survey Annual Statistical Report released today, Australian households on average have managed to increase their wealth over the last decade - but the results show we have not escaped the effects of the global financial crisis.
Wealth inequality has decreased in the past decade as the rich lost some of their affluence - but the wealthiest Australians have remained that way. Meanwhile, there have been significant shifts in the composition of household wealth between 2002 and 2010 - notably the flight from shares to the time-honoured investment favourite of property, and superannuation.
The study of wealth in Australia is relatively recent, with almost no data on the distribution of household wealth existing before 2002, when the HILDA Survey included a series of questions aimed at measuring the assets and debts of households, while the ABS included a similar set of questions in its 2002-03 Survey of Income and Housing (SIH).
Both the HILDA Survey and the SIH have periodically contained wealth collections since then, but as a nationally representative longitudinal survey of Australian households, HILDA has the unique advantage of providing longitudinal data on wealth.
This snapshot of wealth and dynamics in Australian households draws on longitudinal HILDA Survey data to show that direct share ownership has dropped from 4.1% of household asset portfolios in 2002 to only 2.7% in 2010: 15% of households exited share ownership between 2002 and 2010, while only 9% entered share ownership.
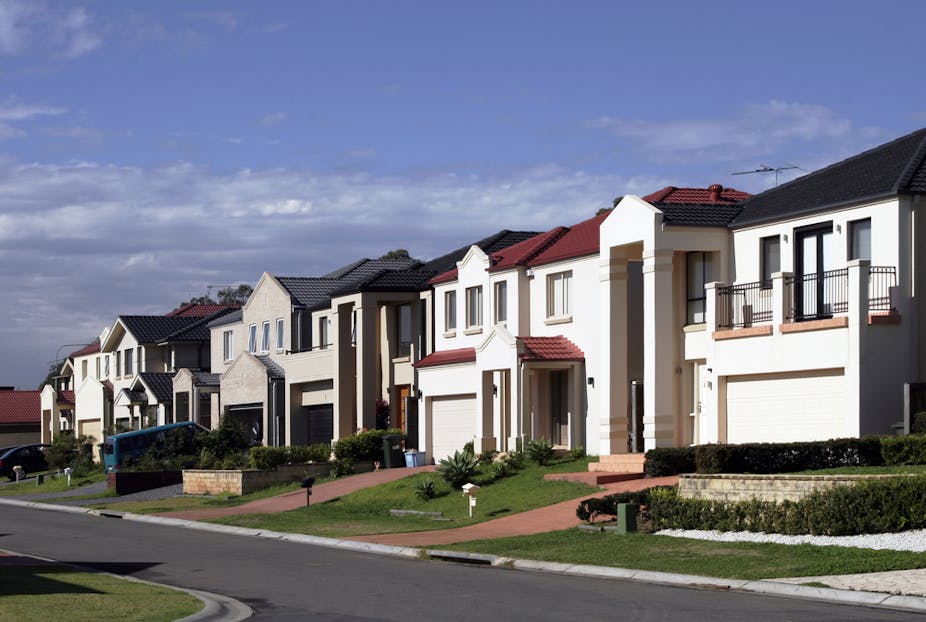
Instead, investors have concentrated on their superannuation and returned to housing - the proportion of households with investment properties rose from 16.1% in 2002 to 20.1% in 2010.
The flight away from equities is, at first glance, surprising given that access to direct investment in shares has never been better, with online trading in particular making it very easy for anyone to invest at low cost. But the global financial crisis and continuing market volatility and poor returns are an obvious explanation for why smaller investors may be put off direct shareholding.
Instead, Australians have substituted indirect share investment through superannuation. Incentives to make additional superannuation contributions introduced by the Howard Government in the early to mid 2000s is likely to be an important driver for this.
HILDA provides a unique opportunity to examine the dynamics of household wealth, and a perhaps surprising degree of dynamism is evident. While average wealth increased substantially in real terms, from $495,000 in 2002 (at December 2010 prices) to $684,000 in 2010, significant numbers of people experienced declines in household wealth. Some 27% of individuals experienced a decline in household wealth between 2002 and 2006, and 39% experienced a decline between 2006 and 2010.
Nonetheless, an analysis of the wealthiest 10% of Australians highlights that high wealth is persistent over an eight-year period - that is, the wealthy have remained so. For example, while approximately 40% of those in the top decile in 2002 were no longer in the top decile in 2010, more than half had fallen only to the eighth decile.
But the figures do show a considerable degree of upward mobility in the wealth distribution, with nearly 10% of those in the top decile in 2010 starting in the bottom half in 2002.
The report also shows that there has been considerable growth in household debt between 2002 and 2010, with much of this debt attributable to growth in home loans and rising house prices. Median home values have increased by 86% in real terms from $259,000 in 2001 to $482,000 in 2010.
Associated with this rise in housing debt has been a small increase in households with negative housing equity – that is, housing debt greater than the value of the home.
Despite this, it appears that the debt burden is mostly within income-earning capacity, with only 6% of households at “dangerous” debt-to-income ratio levels, of more than of 6:1.
The decade to 2010 was, broadly speaking, one of considerable growth in the wealth portfolios of Australian households. This was, however, very much underpinned by the strong performance of housing over the period.
This should sound a warning of vulnerability of future household wealth to house price movements. Indeed, the March ABS House Price Index shows real house prices have on average fallen since 2010, and prices may continue to fall for some years to come, suggesting growth in household wealth will be slowed, and possibly reversed, over the near term.