
What affects a Poll’s Margin of Error?
There are two things that affect the margin of error (MOE). They are the poll’s sample size (n) and the estimated or assumed proportion (p); the estimated proportion is just a poll’s percentage divided by 100. The maximum margin of error for a particular sample size is obtained when p = 0.5 (equivalent to 50%). The margin of error is proportional to the square root of p*(1-p). This means that the major parties’ primary votes and two party vote will be near the maximum margin of error, but the Greens are currently on around 10% of the vote, and this means that the MOE for the Greens will be less than for the major parties.
The MOE is inversely proportional to the square root of the sample size, so we need bigger samples to produce more accurate polls. A sample of 400 will produce a maximum MOE of 5%, and approximately 1100 gives an MOE of 3%. We then need 2500 for an MOE of 2% and 10,000 to get this down to 1%. However, note that if the poll is methodologically flawed, and thus is biased for or against one party, the poll will not be an accurate reflection of the result no matter what its sample size is!
So what does the MOE mean?
Virtually always the reported margin of error assumes the maximum MOE for that sample size, ie, p = 0.5. It also nearly always assumes that a 95% confidence interval is being used. If a poll with a sample size of 1100 reports a two party vote of 50-50, that means that there is a 95% chance the true value for either party is between 47% and 53% (+/- a 3% MOE). This does not make it a certainty that the true value is indeed between 47% and 53%; 1 in 20 polls will miss the true value by more than the MOE.
The MOE does not mean that a change in the poll that falls within the MOE has no effect. Intuitively, we know that going from 49% to 50% and then 51% in a poll will increase the chance of victory, even though all 3 values lie within the 3% MOE for a poll of 1100.
The chart below assumes we have a poll for a single-member electorate. The horizontal axis shows possible results of that poll in two candidate terms, and the vertical axis has the probability that candidate A actually wins the seat (receives over 50% of the vote) given that poll result. The blue line is for a sample size of 1100 and the green line a sample of 400. This analysis also assumes that the poll is unbiased, and that the time between taking the poll and the election is not a factor.
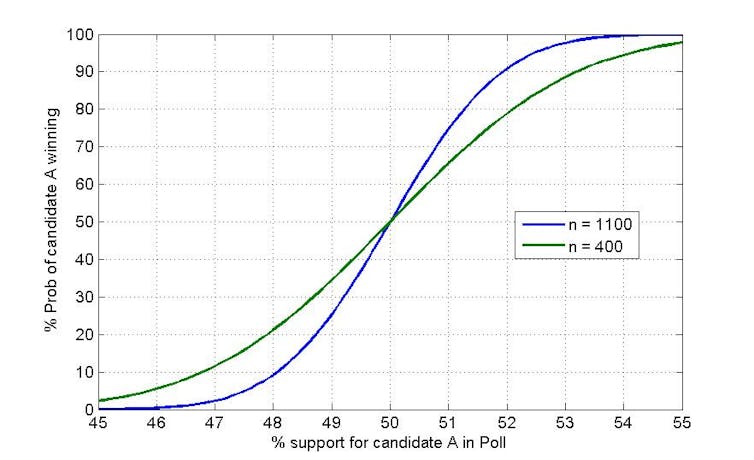
For both lines, the slope is greatest near 50%. Reading off the chart, the probability of winning with a poll of sample size 1100 is around 25% if the poll result was 49%, but improves to 50% with a result of 50% and 75% if the poll said candidate A had 51% support. This is less dramatic for the 400-sample poll, but the probability of winning still increases by 30% moving from 49% to 51% in the poll.
In summary, a 1% rise or fall in the vote in a poll will still affect the chance of winning an election, especially if the vote is close to 50%, even though a 1% change is well within a 3% MOE.
A note for statisticians: The probability of winning in the chart is equivalent to the P-value of a one-sided test of the hypothesis: H0: actual vote >= 50%.