
It’s not been a good year so far for major transport projects in Australia’s capital cities.
The scale of disagreements over the merits of Melbourne’s proposed East West Link was such that the Victorian Government recently paid out $339 million simply for the project not to be built.
In Queensland, Annastacia Palaszczuk became the fourth successive Premier to completely throw out her predecessor’s signature infrastructure project – in this case the Bus and Train (BaT) Tunnel.
While Sydney’s WestConnex project is still going ahead, recent reports concluded that it will either substantially increase traffic on the much-maligned Parramatta Road, or maybe decrease it. It all depends on which report you believe.
Why such discrepancies?
I am not going to debate the relative merits of these schemes. My background is in applied mathematics and not in transport planning. As such, my interest is less in the conclusions of some of these predicted usage studies and more in the consequences of the assumptions made in the modelling.
How can one report filed with the NSW Major Project register predict 20,000 fewer cars per day on a section of Parramatta Road, while other reports within the Roads and Maritime Services state that no significant reductions are likely to be seen?
It is very easy to chalk up some of these differences either to wildly overoptimistic developers potentially misleading themselves and others to get a project approved. Similarly, it is sometimes alleged that feasibility studies might be influenced by political biases or pre-established views on the merits of roads or public transport schemes.
While these factors may well influence some decision making, one thing that is often missed in the reporting of such studies is the sheer complexity associated with analysing such networks. Assuming all roads are connected, the behaviour of a whole network can be hyper-sensitive to how individual parts, even seemingly minor ones, function.
A poor estimate of traffic flow in one section of a network can lead to hugely different behaviour across the whole system. Furthermore, even the simplest networks can have the potential to function in some extremely surprising and often counter-intuitive ways.
It is very easy to believe that if a traveller is offered the choice of two routes for a journey that the addition of a third choice should not worsen his/her travel time. If the new route is slower, the traveller could simply ignore the new route and make the same choice as before.
As the German mathematician Dietrich Braess pointed out, this is not always the case. Increasing the capacity of a network can, perhaps surprisingly, decrease the efficiency of journeys around it even without increasing the number of trips made, as was pointed out in a recent article.
The Braess’s Paradox
To take a closer look at the reasoning behind this paradox, consider the case illustrated below. There are two major cities, labelled as the Start and End locations for a journey.
Travellers between the two cities have two choices of route, either via Town A or via Town B. The roads from Start to Town A and from Town B to End are both highways, which can handle any number of cars and allow them to make each leg of the journey in 105 minutes.
The roads from Start to Town B and from Town A to End are smaller roads which are slower when busy. When there are N cars on the road, each leg of the journey takes N minutes. There is an old road linking Town A to Town B with a journey time of 100 minutes. This road is sufficiently slow that no traveller from Start to Finish would choose a route that involves it.
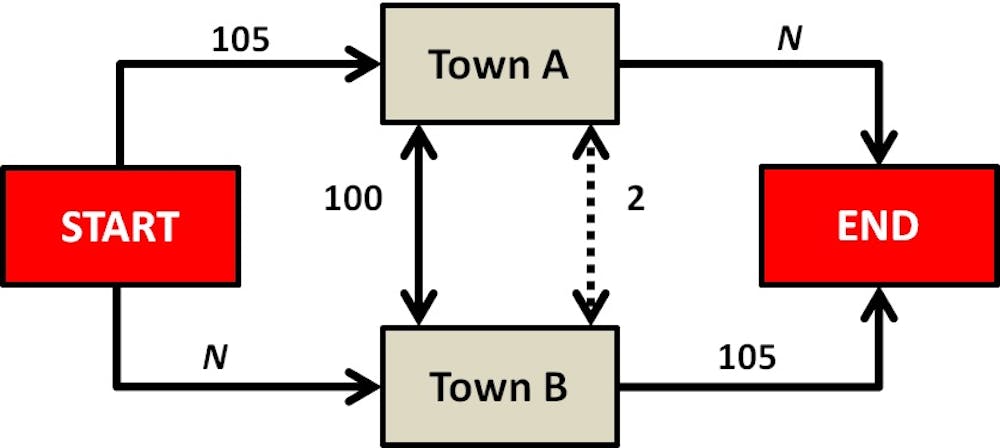
If we assume that 100 cars are travelling at the same time from Start to End, then there is no advantage to going via Town A vs going via Town B. The traffic will split approximately 50/50 between the two routes and each car will do the journey in 155 minutes. This is the fastest route. In reality, the split of cars might not be exactly 50/50, but unless the ratio is heavily imbalanced, the average travel time across the network will be 155 minutes.
Suppose now that the network is “improved” by upgrading the road between Town A and Town B. Rather than taking 100 minutes to travel between the towns, it now takes only 2 minutes.
The fastest route now is for all drivers to go from Start to Town B in 100 minutes, take the 2 minute trip to Town A, then travel from Town A to End in another 100 minutes. This journey now takes 202 minutes – but that’s 47 minutes longer than on the old road layout.
There is no incentive for any driver to choose an alternative route. Opting for either of the 105 minute roads will only lengthen their trip. A driver can improve travel times for all others by selflessly choosing the slowest roads, but cannot help the overall network without suffering for it in the form of a slower journey. This, of course, is not an option which many will choose.
While the old road between Town A and Town B was hugely inefficient, this inefficiency actually ensured that the network as a whole remained reasonably efficient. It served to distribute traffic evenly between the two routes from Start to End. But by improving this relatively unimportant road, it simply redistributes traffic more unevenly and worsens the overall system.
Even more counter-intuitively, Braess’s Paradox is observed in simple physical systems as well as transport networks.
The video (above) illustrates a system whereby a weight is suspended on two springs connected both in series (by an initially tense string) and in parallel (by initially slack strings). Removing the string which is in tension actually leads to the weight being lifted upwards.
This is actually a reverse of our traffic example. The distance the weight hangs represents the longer journey time of the traffic – remove the central string (the new road) and the hanging distance is reduced as is the journey time for the traffic.
Paradox in action
This paradox is not simply a mathematical quirk or one which can be neglected by network analysts. There are a number of examples where removing roads – rather than building news ones – has improved transport networks.
Probably the most famous example of this comes from South Korea. When the motorway network around Seoul was reworked to remove some of the 1960s-built roadways, the the result was significantly reduced transit times throughout the city. This was not because of fewer journeys through the city, rather a more efficient distribution of cars across the remaining network.
Similar phenomena have been observed during road closures in New York City in the United States and in Stuttgart in Germany.
What does this mean for transport models?
As Braess’s Paradox points out, even a slight change to a relatively unimportant part of the whole network can lead to massive changes in travel times. While planning reports might focus on headline stories – new road X will cut travel times by Y minutes – the underlying modelling must be more robust and look at the uncertainty around such estimates.
As painstaking as this modelling may be, it is unquestionably something that needs to be answered as fully and as correctly as possible, admitting its own limitations.
A multi-billion dollar infrastructure project cannot afford to fail simply because someone didn’t do their sums correctly. The financial consequences of incorrect projections can be financially catastrophic.
Both Sydney’s Cross City Tunnel and Lane Cove Tunnel drove their initial operators into receivership. The developers of Brisbane’s Clem Jones Tunnel fared no better.
The issue is not just limited to Australia, of course. Of the 15.9 million journeys expected to be taken between London and Paris during the Channel Tunnel’s first year of operation, a mere 18% of those actually occurred.