

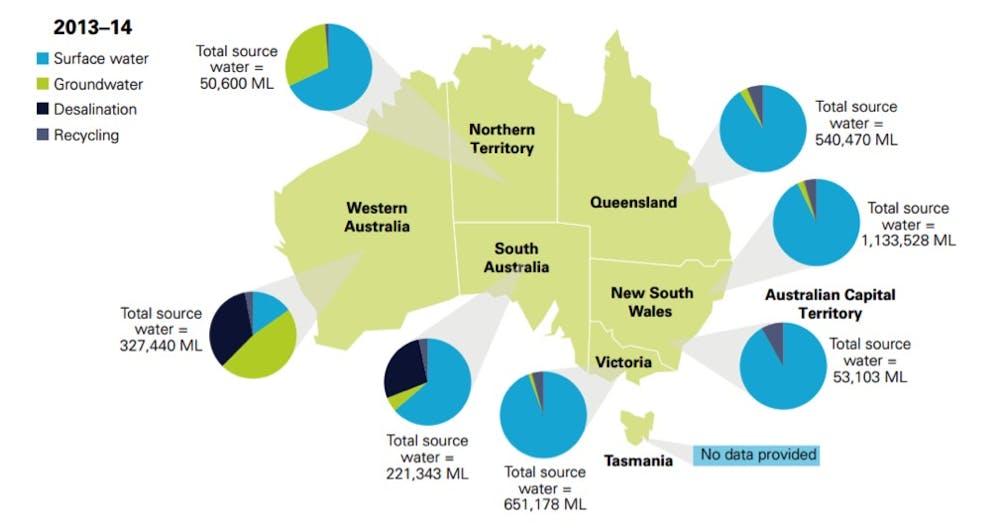
If you live in an Australian city, there’s a good chance that your water comes from surface water such as streams, rivers and reservoirs filled by rainfall and runoff. If you live in Perth, much of your water (about 40%) comes from groundwater.
But you might be surprised to know that a sizeable proportion of water in Australia came from recycling or desalination in 2013-14.
39% of Perth’s water came from desalination and 41% of Adelaide’s. All cities also used small portions of recycled water: Melbourne (4%), Sydney (7%), southeast Queensland (7%), and Canberra (8%).
The Bureau of Meteorology recently released, for the first time, comprehensive national data on these “climate-resilient” water sources, through a new online portal provided as part of the Bureau’s Improving Water Information program.
Climate-resilient water sources are those on which climate variability, such as variations in rainfall, temperature and drought, has little or no influence. The data set provides information on two of the most significant such sources: desalination and water recycling.
So how do these sources fit into the bigger picture of water in Australia?
New data
The data are provided by site owners and operators as well as publicly available information. It’s an initial stocktake of plants with production capacities greater than 50 megalitres (ML) per year.
In total, 360 plants are included (92 desalination and 268 recycled), with a total production capacity of 1,821 gigalitres (GL) per year - more than three times of total Melbourne City Water supply.
This capacity includes 880 GL from desalination (seawater, groundwater and others) and 941 GL from recycled water sources (wastewater, groundwater and others). Each Australian state has its own share of climate-resilient water sources.
The Climate Resilient Water Sources web portal is an interactive site providing comprehensive mapping and information of desalinated and recycled water sources for over 350 sites across Australia, both publicly and privately owned and operated.
Users can access the portal, to search information on capacity, production, location and use of these alternative water sources across Australia.
Where does your water come from?
State water agencies, water authorities and local councils are developing strategies and practices to secure climate resilient water resources for the future. In the last decade, around AU$10–12 billion has been invested in investigating and developing these water sources.
Recycled and desalinated water differ in their means of water treatment and production.
For the purposes of the Climate Resilient Water Sources portal compiled by the Bureau of Meteorology, recycled water is defined as treated sewage effluent, including sewer mining. Recycled water may be potable (drinking water) or non-potable. It excludes urban stormwater use.
Desalinated water is the water created from desalination processes and is not confined to desalinating sea water, so can also include desalinating groundwater. A desalination process is the removal of salt, bacteria and pollution from a water source.
Below you can see the amount of desalinated and recycled water sourced for Australia’s cities in 2013–14 from the National Performance Report released in May 2015.
From the Climate Resilient Water Source data we can also see which parts of Australia have the greatest climate resilient capacity compared to their sourced water (including surface, ground, recycled water and desalination). Western Australia has greater climate resilient capacity than its total water sourced in 2013–14, as you can see in the chart below.
We can also see that more than 50% of reported production of recycled or desalinated water in 2012-13 (410,491 ML) was for urban use (residential, domestic, commercial, industrial, municipal).
The importance of desalination as a reliable source of water continues to grow for drinking water, in particular for the States of Western Australia and South Australia, where constraints on traditional water sources have driven diversification.
Also, industry relies on these sources to maximise their water availability, for example for mining and coal seam gas projects (such as the Gladstone LNG project desalination plant with capacity of 1095 ML each year). Reliance on desalination in other states and territories remains sporadic, with neither New South Wales nor Victorian utilities sourcing any water from their desalination plants in 2013–14.
Similarly, Queensland sourced less than 1% of its total water from desalination sources because of the availability of surface water.
How much water are we using?
Overall, residential water use has grown since 2011, a trend that is consistent with the observed hotter temperatures, average or below-average rainfalls, and eased water restrictions across Australia.
However growth of residential water supply has slowed, from 6% in 2012–13 to 3% in 2013–14. Median water use is now 185 kL per property.
For the 13 water utilities across Australia that supply more than 100,000 properties, all reported (except Yarra Valley Water, Barwon Water, City West Water and SA Water) an increase in residential water supplied from 2012-13 to 2013-14.
Water Corporation in Perth on the other hand continues to supply the highest volumes of water for residential use. This is consistent with the prevailing drier-than-average conditions being experienced in Western Australia and the observed historic water use trends for Perth.
What’s Australia’s water security under future climate?
Water security is threatened by a number of factors. These include climate change, rainfall variability, population growth, economic development, and drought.
For instance, across southern Australia climate change is projected to decrease winter and spring rainfall by up to 15% by 2030 regardless of whether greenhouse gas emissions are reduced.
Rainfall declines are amplified in reduced streamflow and in turn the water in storages. Southwestern Australia has seen streamflow declines of 50% since 1970, while streamflow during the Millennium Drought (1996-2010) in southeastern Australia was half of the long-term average.
This ultimately contributes to reduced storage in city water supplies. During the Millennium Drought, for example Melbourne’s water stores declined to a third of full capacity by 2010, when the call for alternative water sources made.
Australia also has naturally highly variable rainfall influenced by events such as El Niño and La Niña. An El Niño was declared in May 2015.
The El Niño’s likely impact will be drier and warmer conditions across inland eastern Australia. Importantly the strength of an El Niño does not always indicate how severely Australia may be affected.
These dryer conditions, should they arise, will place increased pressure on the water supply of effected regions. In particular, increased water demands and reduced stream flows will see declining surface water storage volumes. This could mean we need to develop and use more climate resilient sources.
However, the current surface water storage volume for all main cities indicates that our cities can meet their urban water use for a number of years. With surface water alone, Adelaide and Perth can meet their urban use for 1-2 years and south east Queensland for almost nine years.
The Bureau’s Water Information programme provides the latest national information on surface water storage and seasonal streamflow forecasts service for key sites across Australia.
But at the same time increasing population and economic development are putting greater demand on water.
The authors would like to acknowledge the contributions of the Australian Water Recycling Centre of Excellence; the National Centre of Excellence in Desalination (NCED); and CSIRO .