Judging from the first week of campaigning, the 2015 Queensland election is going to be very much about economics – and jobs in particular.
On the one hand, Premier Campbell Newman and his Liberal National Party stress that under their “strong economic management”, 1100 new jobs are being created every month and Queensland is on track to become the fastest growing state economy in Australia.
On the other hand, the Labor opposition, led by Annastacia Palaszczuk, has focused on “the savage cuts to jobs” under the Newman government, arguing those cuts have affected the delivery of adequate services, especially in health.
For voters trying to discern the facts behind each party’s spin, two crucial questions are:
- How does Queensland’s economy compare to the rest of Australia?
- How has the economy performed since Newman’s Liberal National government took over from Anna Bligh’s Labor back in March 2012?
The short answer to the first question is: around the average, with some local situations that tend to be among the worst in the country.
As for the second question, I was a little surprised by what the data showed: that Queensland’s economy has fared worse over the past three years than it might appear at first sight.
To offer an independent analysis of those two questions, I have used data publicly available from the Australian Bureau of Statistics. Monthly data for employment and unemployment are adjusted for seasonality using the X-12 software package of the US Census Bureau.
Now, let me add some substance to those short answers.
A snapshot of the Queensland economy today
Table 1 below reports a set of key macroeconomic indicators (looking at the economy as a whole) for each Australian state and for the aggregate Australian economy. See the notes beneath the table for technical definitions.

In terms of Gross Domestic Product (GDP) growth in aggregate and per capita (meaning per person), the Queensland economy is broadly in line with the Australian average. Only Western Australia and Northern Territory appear to clearly outperform the Sunshine State.
But data on Gross Domestic Income (GDI) show that Queensland is well below the Australian average. In particular, GDI per-capita in Queensland has decreased by 1% between June 2013 and June 2014. This is the second largest decline in the entire country.
Conceptually, GDP and GDI measure the same thing: output. However, they do that from two different perspectives. GDP measures “expenditures” while GDI measures “incomes”. The discrepancy between the two arises because of measurement errors.
GDP is the more popular of the two measures, but recently most Statistical Offices have started reporting both. In fact, it has been shown that GDI tends to suffer from a smaller measurement error than GDP.
GDI is therefore likely to be a more reliable predictor of the business cycle of the economy. And this is not good news for Queensland, because it means that we might be going through a much less favourable economic phase than we believe.
In terms of labour market performance, Queensland currently has the equal highest unemployment rate in the country (6.9%), matched only by Tasmania, even though this is only a few decimal points higher than the Australian average (6.3%).
Youth unemployment in Queensland (14.1%) is marginally below the Australian average of 14.5%. However, there is a lot of regional variation within Queensland. In Cairns, for instance, youth unemployment is above 21%, one of the highest rates observed in Australia. Conversely, in Mackay youth unemployment drops to 8.6%.
Newman vs Bligh on jobs and growth
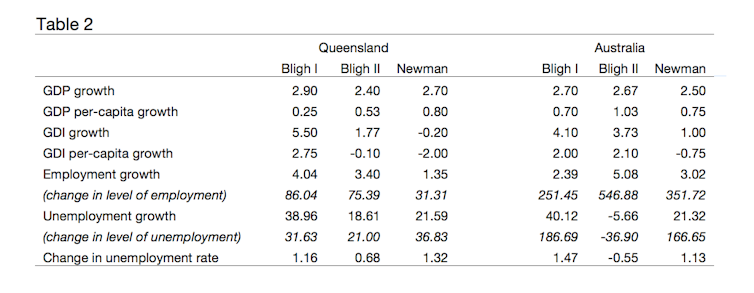
In Table 2, I report the change in several macroeconomic variables since 2007. The period of observation is split in three sub-periods corresponding to the latest three Queensland governments: Bligh I (September 2007-March 2009), Bligh II (March 2009-March 2012), and Newman (March 2012 to the latest available information).
The table reports the data for Queensland and Australia overall. In terms of economic growth, again GDP and GDI provide quite different indications. According to GDP, the Queensland economy under the LNP government has performed on par with the Australian aggregate – slightly better, in fact.
Conversely, GDI data present quite a dim picture, with Queensland doing much worse than the Australian average and, more importantly, experiencing a net 2% decline in income per-capita. In this respect, the LNP government has delivered a significantly worse outcome than the previous two Labor governments.
Employment performance appears to be the highlight of the LNP government. The increase reported in the table corresponds to an average of about 970 new jobs per month between March 2012 and November 2014.
But, unfortunately for Queensland, this is only part of the story. First, practically all of the new jobs created are part-time. In fact, full-time employment decreased during the period of observation from 1.634 million to 1.626 million. Those are “original” figures; the seasonally adjusted figures show an even stronger decline. (You can read more about seasonal adjustment of jobs data here.)
Second, unemployment has grown. Now, the increase shown in the table refers to the seasonally adjusted data and is considerably larger than the increase resulting from the original data. Still, the creation of new jobs occurred while existing jobs were being destroyed.
As a result, the seasonally adjusted unemployment rate increased from 5.5% in March 2012 to 6.9% in November 2014. Even the original data show an increase in the unemployment rate, albeit of a much more modest magnitude.

Overall, under the LNP government, the Queensland labour market appears to have performed worse than the Australian average.
Also, it does not seem that the Newman government has outperformed either of the two Bligh governments. During Bligh’s time in power, from September 2007 to March 2012, the Queensland economy experienced higher GDI growth, faster employment growth, and a smaller increase in the rate of unemployment.
The Newman government did marginally better than the Labor government in terms of GDP per-capita growth and better than Bligh I in terms of limiting the growth in the number of unemployed people. However, the growth in unemployment during Bligh I occurred at a time when Australian unemployment was growing even faster.
* Editor’s note: Fabrizio’s author Q&A is now over, but – as many of you requested – we have now published a follow-up article on Queensland debt. You can read all of our Queensland election coverage here.

