
There has been no real change in the proportion of children living in poverty in the past year, according to new statistics released by the government. The proportion of children living in relative poverty, before housing costs were taken into account, remained stable at 17% in 2013-14 – or 2.3m children. After housing costs, the number rose very slightly from 27% to 28% on the previous year after rounding – standing at 3.7m children.
The UK’s relative poverty measure captures the proportion of children in households with income less than 60% of the median for the country – £416 per week before housing costs for a couple with two children. Since 2010, this measure of child poverty has been stable because despite unemployment, and cuts in family benefits, median incomes across the population have fallen. Median income did not rise again in 2013-14 and the cuts were still working their way through.
The government has once again begun to question the relative measure. The coalition government launched a consultation on the relative child poverty measures in 2012, arguing that it was absurd that the child poverty rate should fall just because median incomes fall. After consultation they backed off because of considerable scientific criticisms from many quarters.
This new Conservative government is now raising the same issue for the opposite reason – that if median incomes rise, so too will child poverty. There are signals that the government may move to abandon the legally binding child poverty targets introduced by the Labour government in the 2010 Child Poverty Act. Yet this is the measure used by the European Union, the Organisation of Economic Co-operation and Development, UNICEF and most governments in rich countries.
Five ways to measure child poverty
No single poverty measure is perfect. For that reason a portfolio of measures has been developed over the past three decades as a result of an open discussion between academics and government statisticians. Each measure has its advantages and disadvantages. Four measures were incorporated into the Child Poverty Act targets and a fifth was added later. They are:
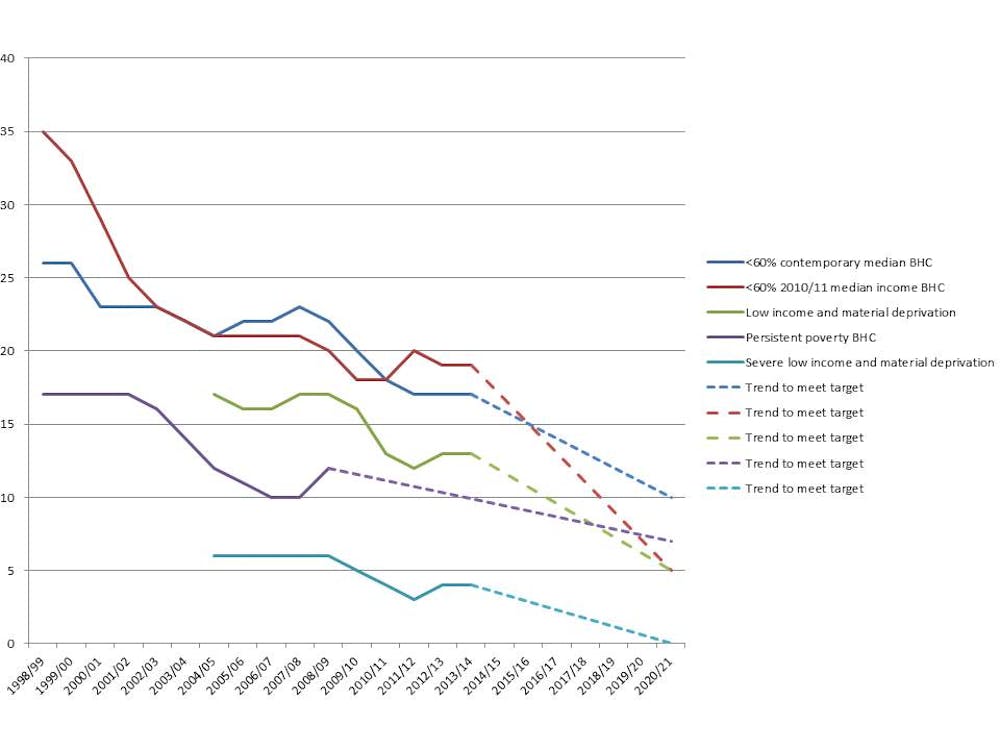
The so-called relative measure: the percentage of children in households with incomes less than 60% of the contemporary median. In 2013-14 this was 17% before housing costs, the same as the previous year. The child poverty target is to reduce this to 10% by 2021.
The so called absolute (I prefer “anchored”) measure: the percentage of children in households with incomes less than 60% of the median, held constant at 2010-11 prices. The child poverty rate on this was 19% before housing costs in 2013-14 and the target is to reduce this to 5% by 2021.
The low income and deprivation measure: the percentage of children in households with less than 70% of contemporary median income and lacking because they cannot afford necessities. There is a list of 12 necessities including a bedroom for each child of the opposite sex aged more than ten-years-old, school trips, a warm winter coat, a hobby and celebrations on special occasions. The poverty rate on this was 13% against a target for 2021 of 5%.
Persistent low income: the percentage of children in households with income less than 60% of contemporary median in three out of four years. The child poverty rate is 12% (though this estimate is out of date) and the 2021 target is 7%.
Severe low income and material deprivation: the percentage of children in households with income less than 50% of the median and lacking because they cannot afford necessities. This child poverty rate is 4% and the 2021 target is 0%.
Most of these statistics are also produced by the Department for Work and Pensions after housing costs and also using 50% and 70% thresholds. The graph below shows what has been happening on each of these measures since 1998 and the trends needed to reach the 2020 Child Poverty Act targets.
Material issues
The government says that it would like to take account of the causes of child poverty and has mentioned: indebtedness, family breakdown, addiction, housing problems, educational attainment and worklessness. All these may be associated with child poverty but they are not measures of child poverty – rich families also break down.
What ministers are clumsily trying to do is to get the measures to focus on individual behaviours rather than most of the structural causes of poverty. These are unemployment, low pay (67% of poor children live in households with someone in work), high childcare costs, high rents and, yes, cuts in benefits and tax credits and the overall erosion of a safety net. The £12 billion more cuts in working-age benefits on top of the billions already imposed are set to wipe away all the gains in child poverty reduction since 1999.
Poverty is a lack of material resources, not drug addiction or family breakdown or any of these factors. Children living in poverty in the UK as currently measured are more likely to die in the first year of life, be born small, breathe second-hand smoke, become overweight, perform poorly at school, die in an accident or become young parents. As adults they are more likely to die earlier and be out of work, live in poor housing, receive inadequate wages and report poor health.
Child poverty is currently costing £29 billion per year, and the long-run impacts of failure to address the problem will cost much more. The response from politicians appears to be to re-define the measure.