

Public health authorities are forever telling us how much we should weigh, but one essential element is missing: shape.
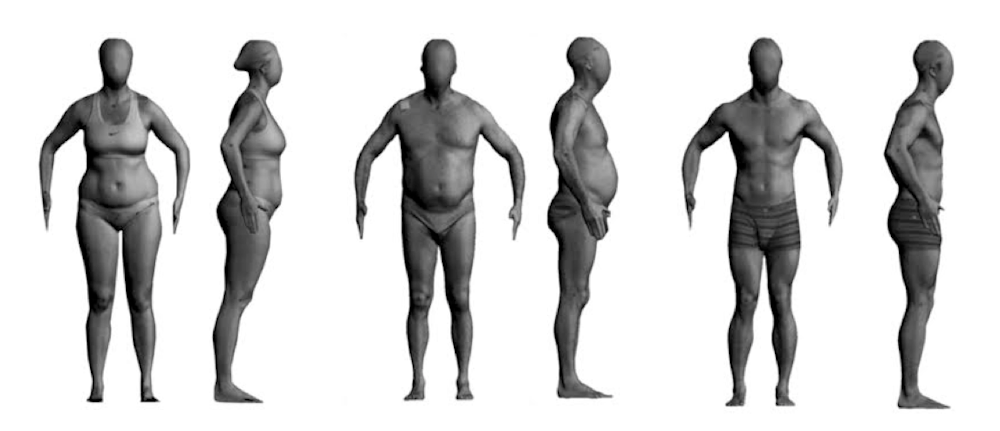
Let’s start with a little quiz. Below is a series of 3D laser scans of bodies, each seen from the front and the side. A 3D laser scanner is a miracle machine that creates a digital statue of your body painlessly and in a matter of seconds. Your task is to rank the bodies in order of fatness.
Now there are lots of ways to measure fatness — we’ll come back to that — but for this quiz I want you to rank them according to body mass index (BMI), the most commonly used method of quantifying fatness.
You will recall that you calculate your BMI by dividing your weight in kilograms by the square of your height in metres. For adults, a BMI under 18.5 is considered dangerously thin, 18.5-25 is the healthy weight range, 25-30 is overweight, and 30 or over is obese.
OK, have you ranked them? To get the answer, you will have to read all the interesting stuff between here and the end of the article.
I’ve written before about the shortcomings of BMI. What it all boils down to is this: BMI doesn’t take body shape into account. If we went at this logically, we’d observe that the volume of a box increases with the cube of the length of the side.
So if humans were geometrically similar regardless of their size, we should have an index that divides weight by the cube of height. There is in fact such an index – it is called the Rohrer Index or the Ponderal Index, and was proposed in 1921 by the eponymous Dr Rohrer.
But humans are not geometrically similar. As people get taller, their legs, and particularly their upper legs, get proportionally longer. Tall people look a little more like wolfhounds, shorter people like staffies. If someone 190cm tall had the same relative leg length as someone 150cm tall, they would shrink to 185cm. So the volume (and hence the mass) of tall people is somewhat less than you would expect based on their height, and taller people are at a BMI disadvantage.
Take gym junkie Jenny. She’s 170cm tall, weighs 70kg and is ultra-lean with only 10% body fat. We can calculate that her body volume is 65 litres. Now compare her to her sedentary sister Suzie, also 170 cm and 70kg, but 40% body fat. They’ve got the same BMI (24.2), but Suzie has a body volume of 69 litres, because fat is less dense than muscle and takes up more space. Those extra four litres have to go somewhere, and Suzie’s got a pretty good idea of just where they have gone.
In the same way, the shape of people has changed over time. People today are fatter at the same BMI than people in those slimmer, bygone days — more Suzie, less Jenny.
Those who study the human body and its movements, anthropometrists, seem to enjoy creating indices of ideal weight. My favourite is Broca’s Index, named after the French anatomist Paul Broca. I like its simplicity: your ideal weight is your height in centimetres minus 100. For me that makes exactly 80kg, which is also exactly my weight. I rest my case.
I like this more than the stripped-down versions of my ideal weight prescribed by other various body weight scales such as Hamwi (77.9kg), Creff (77.5kg), Devine (75.5kg), Monnerot-Dumaine (74kg), Robinson (73kg), Lorentz (72.5kg), Miller (72kg) or – and this is really getting absurd — the lower limit of my healthy BMI range (60kg).
Researchers are hard at work developing new shape-based indicators. These typically use combinations of height, weight and waist circumference of often mind-boggling complexity.
The A Body Shape Index proved to predict risk of death quite well, but just never caught on. It needed waist circumference, which is not easy to measure. There are at least six different waist measurement sites, and it requires a bit of expertise to get it right.
My hopes are similarly low for the recently launched Surface-Based Body Shape Index, even if it does outperform BMI as a predictor of all-cause mortality. The Surface-Based Body Shape Index also requires a complex measurement that involves running a tape from the groin over the shoulder to the bum crack, which I can see leading to some resistance in the average GP’s surgery.
So the bottom line, so to speak, is this: yes, shape-based indices would be better than BMI, but they are hard to measure, they mean nothing to the general public, and there are only limited data for comparison. In the meantime, hard-done-by Jennys and disadvantaged wolfhounds will just have to put up with it.
So, how do the bodies compare? Well, all of these people have BMIs of exactly 25. The first person is 1.68m tall and weighs 70.6kg. The second is 1.59m and 63.2kg, and the third is 1.74m and 75.7kg.
Tim will be on hand for an Author Q&A between 3:30 and 4:30pm AEDT on Thursday, January 28, 2016. Post your questions in the comments section below.