

The UK’s national income, gross national product (GDP), returned this month to its peak level in 2008. By my count that is six years to get back to where we were, the slowest recovery on record. Still, we are back, and we need to understand why and how.
The first step is to see where we are in a bit more detail. After all, GDP is far from the best indicator of either recession or recovery.
The chart below includes the level of employment (for those 16 years or older), along with GDP. Both are measured as percentage point differences from the first quarter of 2008. A casual glance at the diagram suggests that something rather strange – or at least unusual – is in process. While GDP is only fractionally above its 2008 level, employment is up a full 3%.
GDP, employment & GDP per hour worked
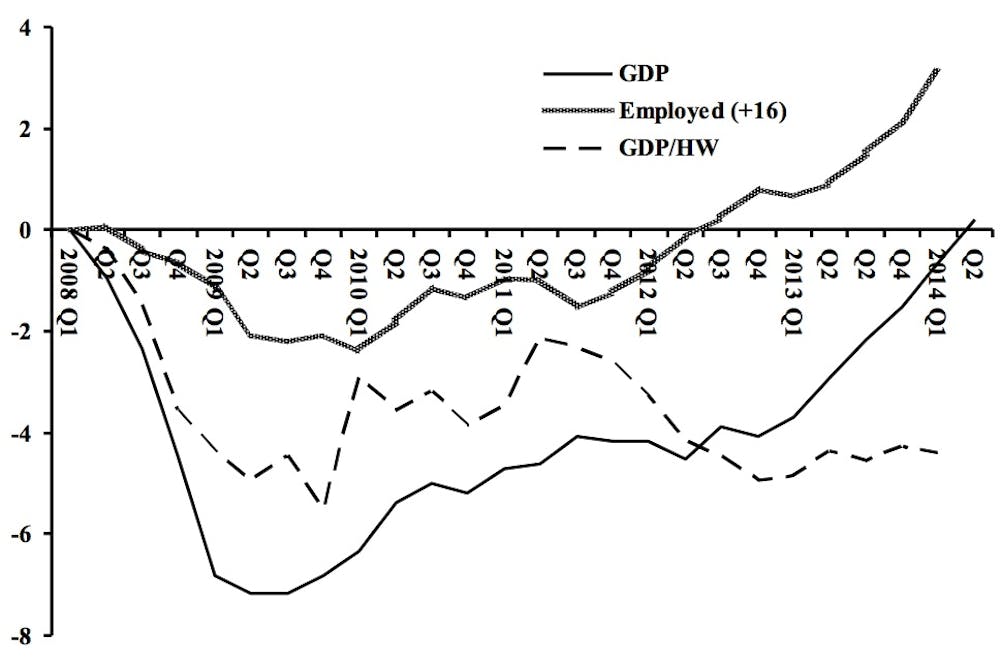
You need not be an economist to draw the obvious inference – output per worker hour today is more than 4% lower than it was in 2008 (GDP/HW in the chart). Why should productivity fall as an economy recovers to its previous peak? Before seeking an answer, we can dismiss the favourite neoliberal possibility, that the decline is the result of feckless public sector workers. On the contrary, the statistics show roughly constant productivity in public services, where employment has fallen, and declining productivity in the private sector.
There are two obvious explanations for why a country’s private sector might become less productive. First, private employers may cut back production, but cut back employment by less. Since private companies are not charitable institutions, this possibility has limited credibility, unless part-time work grows relatively to full-time work. The statistics support this. At the beginning of 2008 about 15% of those defined as employed part-time wanted to work more hours. At the beginning of this year the number was slightly more than 30%.
The second possibility is that the growth of employment has been concentrated in low wage, low productivity activities. Again, this is what the ONS statistics show, with the largest employment growth in services, and not high-wage services in the City. This matched by declining real wages for instance, much of which is a result of more workers in low pay sectors and fewer in jobs that pay well.
Going global
One consequence of declining productivity is a loss of international competitiveness, and the next chart shows that clearly. The UK trade deficit, for commodities and services combined, stagnated during the recovery, fluctuating between 1.5% and 2.5% of GDP.
Measured in constant prices, exports of commodities at the beginning of 2014 were almost 2% below their level in 2011. Whatever else might have nudged recovery, it wasn’t exports.
UK current account & trade balance as share of GDP
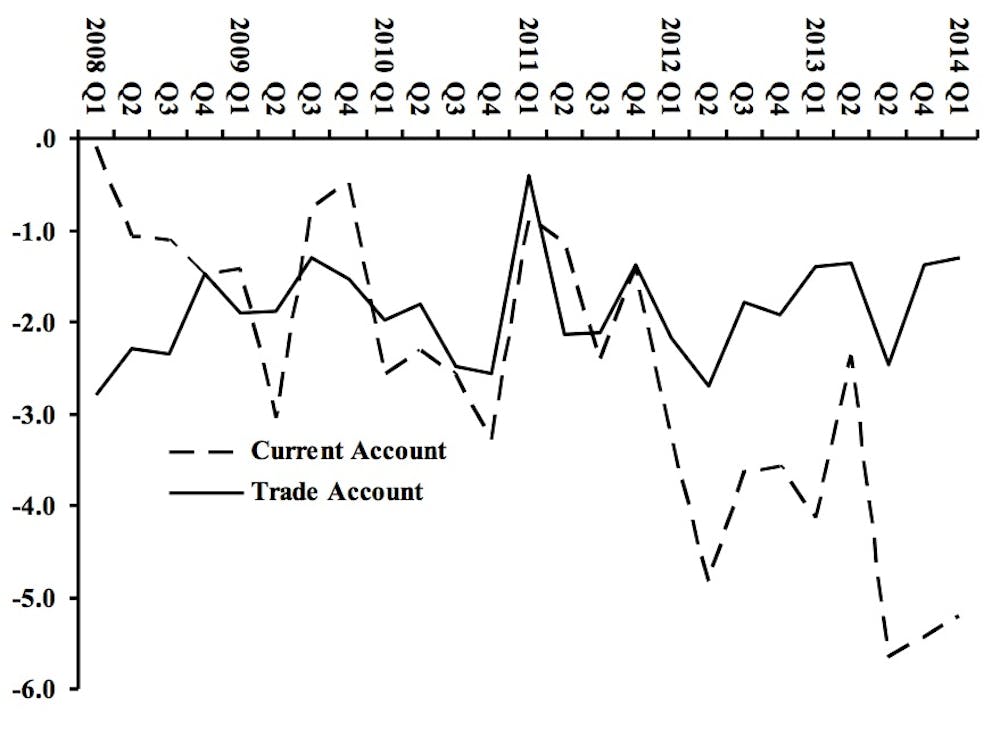
The chart also shows that poor export performance has gone along with a dangerous deterioration in the current account – the trade balance plus flows of money in and out of the country. The June ONS report points out the consequences:
The UK current account – which has been consistently negative since the late 1990s – deteriorated markedly in the second half of 2013, with deficits of 5.6% and 5.4% of nominal GDP in Q3 2013 and Q4 2013 respectively. This deterioration was widely noted (Bank of England May Inflation Report) as it suggests that the UK is becoming increasingly dependent on inflows of foreign capital to fund its current account.
“Becoming increasingly dependent” on capital inflow by definition means that the UK private sector is accumulating debt in foreign currencies. Optimists might argue that if the accumulated debt finances investment in new factories, technology or infrastructure, then such debt is a benefit not a problem. The chart below suggests that such is not the case: private investment in the UK economy is 17% lower than in 2008.
Declining private investment
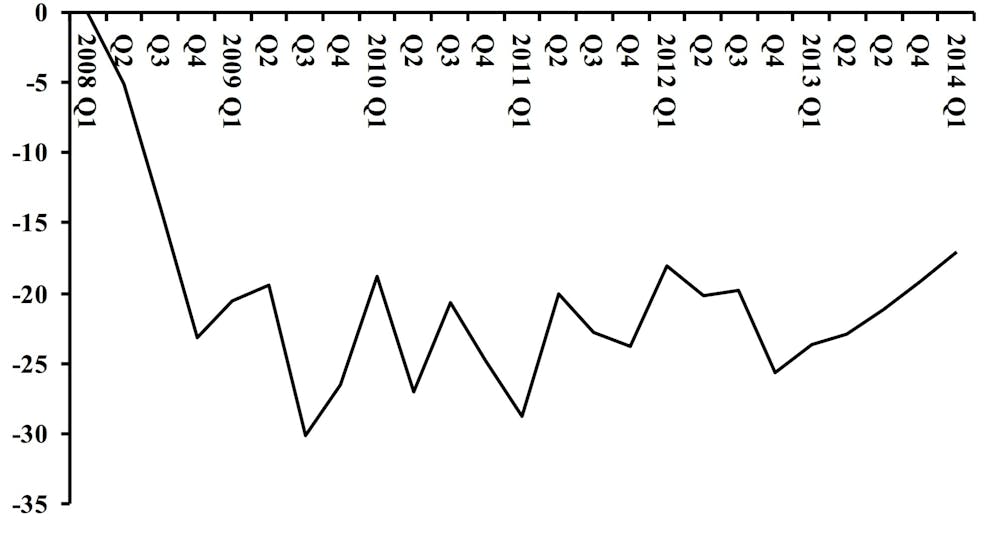
A recovery with investment far below six years ago, for the same level of GDP – what does that imply? One obvious result is low productivity, where we began.
The UK recovery from the great recession can be summarised in the following points:
- It was the slowest on record
- It was burdened with falling productivity, probably due to a shift toward low wage, low skill, low productivity sectors increasingly based on part-time employment
- Export performance weakened, almost certainly due to stagnant productivity
- There was a dismally low level of private investment
I suspect the chancellor is celebrating. In his view the economy is on the road to recovery with one of the highest growth rates among the G7 countries. The UK does appear to be on a road, but it’s the low road to poverty and instability, not prosperity.