
The magnitude 9.0 Tōhoku-Oki earthquake of March 11 last year was the largest earthquake in Japan’s modern history. In fact, it was the fourth-largest earthquake anywhere in the world since 1900.
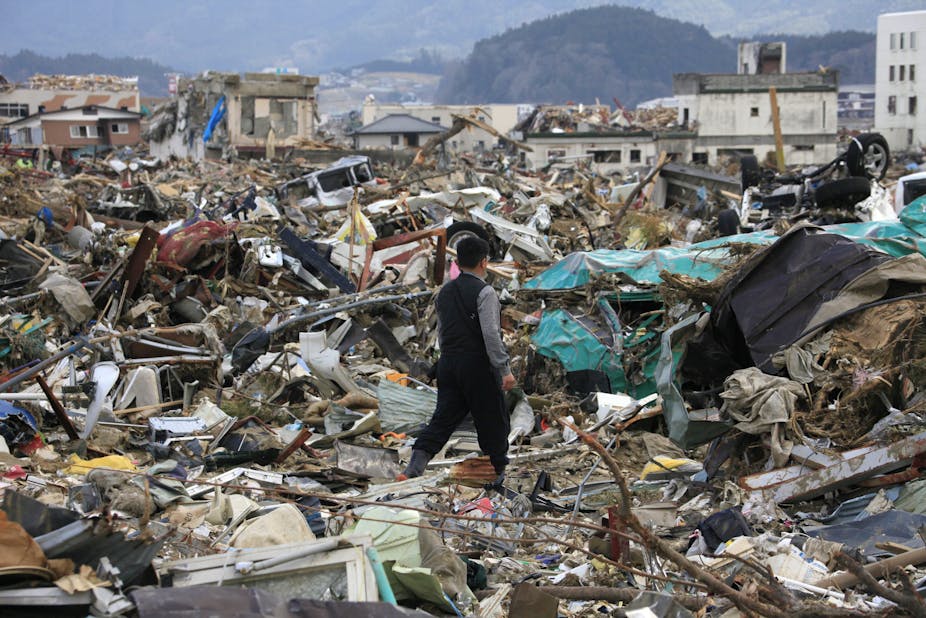
The earthquake triggered a tsunami off the Japanese coast which led to the Fukushima nuclear disaster and caused as much as US$30 billion worth of damage.
Thanks to the scientific investments of the Japanese government after the magnitude 6.9 Kobe earthquake of 1995, last year’s event was recorded by thousands of sensitive seismometers and geodetic instruments across Japan. As such, it was the best-recorded earthquake in human history.
Now, a year after the Tōhoku-Oki earthquake, we seismologists are working hard to come up with new and better ways to understand this event.
In a study published in the March/April edition of Seismological Research Letters my colleagues and I presented a new way to look at (or listen to) the seismic data collected during this earthquake.
We were able to bring earthquake data to life by combining seismic auditory and visual information. In this way, you can to listen to changes in pitch (the notes) and amplitude (volume) of the quake, while watching seismic frequency changes.
So what do these changes in amplitude and pitch mean? Well, they can help explain various aspects of the earthquake sequence, including the main shock and nearby aftershocks. For instance, the above video was converted from seismic data recorded near the coastline between Fukushima – the nuclear reactor site – and Tokyo.
The initial blast of sound is the magnitude 9.0 main shock. As the Earth’s plates slipped into new positions, aftershocks are heard as the “pop” noises immediately following the main shock sound.
Expressing the seismic data in audio form can also help us identify interesting features of the earthquake that are not easily visible by eye. For instance, we found that the “pops” heard in the Tōhoku-Oki data indicated more aftershocks than were reported in the Japanese earthquake catalogues.
Now we are coming up with ways to detect and locate those missing aftershocks, and using them to better understand how aftershocks are triggered by the main event.
Importantly, this way of presenting earthquake data allows us to relate the earthquake signals to familiar sounds, such as thunder, popcorn popping and fireworks. This can help us better convey scientific information about this and other earthquakes to a general audience.
We are still far from accurately predicting earthquakes. Unlike weather prediction, where we have satellites above us to see the clouds, we can’t directly measure stress build-up tens of kilometers below the earth’s surface.
Instead we have to rely on seismic waves or other indirect ways to sample or sense the regions where large earthquakes nucleate. This, together with the fact that fault systems are extremely complex, makes earthquake prediction extremely difficult.
But with the massive amount of seismic data collected during last year’s earthquake, together with new innovative ways to analyse and present this seismic data, we can better understand what happened before, during and after this huge event.
This, in turn, could help us find ways to prevent seismic hazards from turning into nature disasters, if not predict them.
Further listening: