
With the Australian Bureau of Statistics (ABS) in the news over possible plans to abandon the five-yearly population census, we might recall that a program of cuts to the ABS budget started under Labor – and then accelerated under the Coalition’s 2014 federal budget.
In an article on The Conversation last year, my colleagues Simon Darcy and Bronwen Dalton drew attention to the revision of the ABS work program which resulted in the cessation of the ABS’s periodic national surveys of cultural and sporting participation. At the time of those announcements, the latest versions of the surveys were already in the field, and the results have now been published in cut-down form by the ABS on its website.
The purpose of this article is to summarise the key results from the cultural participation survey to demonstrate the usefulness of the data in relation to cultural policy.
Cultural policies past and present
The policy context is provided by Creative Australia, the national cultural policy, which was published in 2013, when Simon Crean was still the Labor Minister for the Arts.
Although there was no mention of the arts in the Coalition’s formal 2013 election manifesto, during the campaign George Brandis, then opposition spokesman on the arts, now Minister for the Arts, declared that most of the ideas in Creative Australia were “good ideas in themselves” but he did not approve of the “derivative” approach, in which the arts were seen as a tool for development of policies in such areas as communications, education or trade.
The document is still available on the website of the Ministry of the Arts so, for the time being at least, it would appear that Creative Australia remains government policy – a rarely acknowledged example of bi-partisanship.
While Creative Australia concentrates mainly on supply-side issues – artists, organisations, funding, infrastructure – and participation is not one of its “five goals”, it does assert that “successful implementation of Creative Australia” will be reflected in an increase in “attendance at cultural venues and events” and “participation in cultural activities”.
Measuring the success of cultural policy
Neither base-data starting points nor future participation targets are presented, but participation was to be tracked by the Cultural Ministers ***** Statistics Working Group (so-named even though no Australian government has a Minister of Culture) which supported a “national program of cultural data collection, research and analysis … underpinned by the National Centre for Culture and Recreation Statistics”, the latter being a unit of the Australian Bureau of Statistics, which was disbanded in the 2014 round of cuts.
In 2010, the Cultural Ministers Council had published Vital Signs: Cultural Indicators for Australia: First Edition for Consultation , which included cultural attendance and participation as two of 16 indicators designed to “support strategic planning and investment in the provision of arts and cultural resources and services” and to “inform evidence based decision making and evaluation of public policy”, and included relevant ABS data. However, there appears to have been no second edition.
It seems unlikely that the new ABS data will be publicly used by the Ministry for the Arts to evaluate progress in the implementation of Creative Australia: it is, after all, early days, both for the government and the cultural policy.
But increasing cultural participation is hardly a new policy: the predecessor policy statement, Creative Nation, launched by Paul Keating in 1994, sought to enable “all Australians to enjoy the widest possible range of cultural experience”. So some comments on the success of this policy, in light of newly available data, are offered here.
Engaging with the arts
The main agency for managing federal government cultural patronage, apart from the ABC and SBS, is the Australia Council.
Its new Strategic Plan, 2014-2019, has four goals, one of which is for the arts to “enrich daily life for all” and one of its four sub-goals is to “ensure more Australians have access to and engage with the arts”.
It should of course be acknowledged that state and local governments are also key players in cultural policy, as are the voluntary and commercial sectors. Of the AU$7 billion a year of public expenditure on arts and heritage in Australia, just A$2.4 billion is from federal government (of which half is for the ABC and SBS), A$3.3 billion from state government and A$1.3 billion from local government.
The ABS’s 2014 survey of Attendance at Selected Cultural Venues and Events is the sixth in a series conducted about every four years since 1995, with a common design, so that trends can be examined. So what are the trends?
The news is mixed.
How do we participate in the arts?
First, the good news.
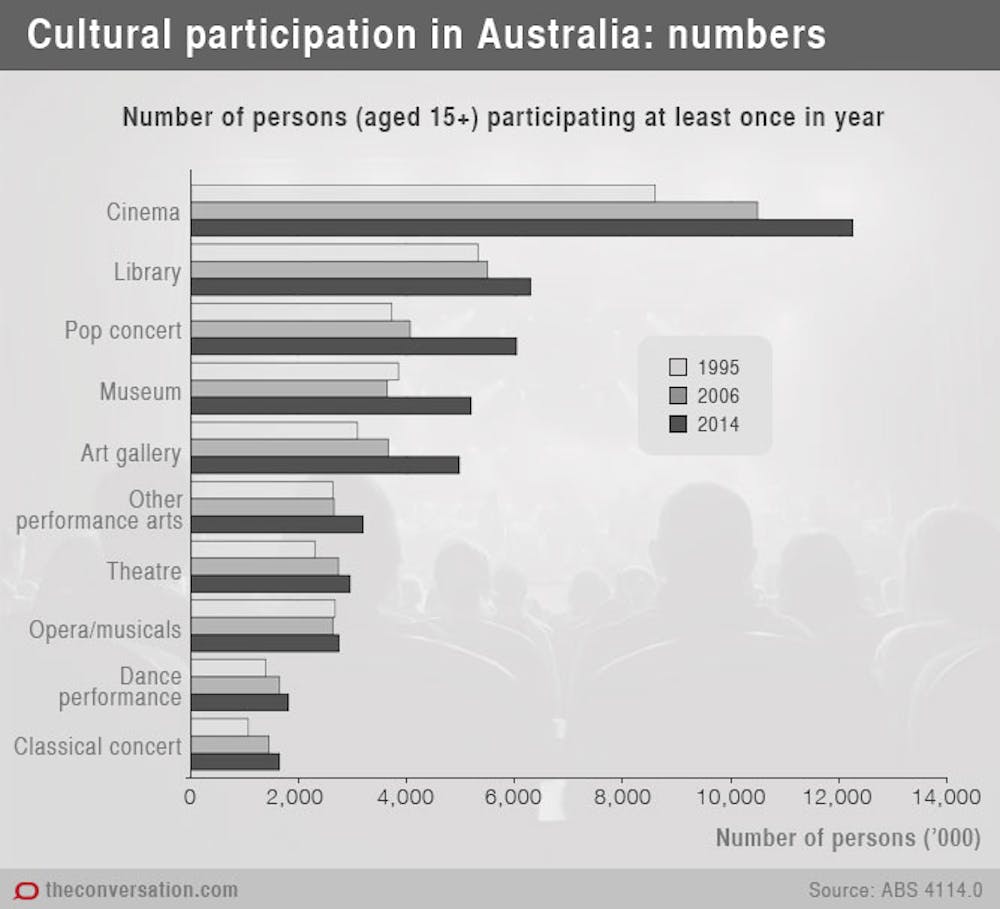
The above chart, based on the 1995, 2006 and 2014 surveys, shows the estimated numbers of adults in Australia participating at least once a year in ten different cultural activities: all the trends are upwards – although for opera/musicals it’s only just.
The chart refers to persons, not visits. To convert to visits would require multiplying the number of persons by their frequency of attendance. This information is not supplied by the ABS in the published tables for 2014, but has been supplied in earlier versions of the survey, which indicate average frequencies varying from just twice a year for opera/ musicals to 12 times for libraries.
Being based on a survey of Australian residents, the figures do not of course take account of visits to cultural venues by overseas visitors to Australia, but conversely may include some data referring to Australian residents’ visits to cultural venues overseas.
But these increases in numbers took place against a background of increasing population: between 1995 and 2014 the adult population grew by 4.4 million, that is by almost a third.
A more sobering picture is therefore presented by the chart below, which refers to percentages of the population participating.
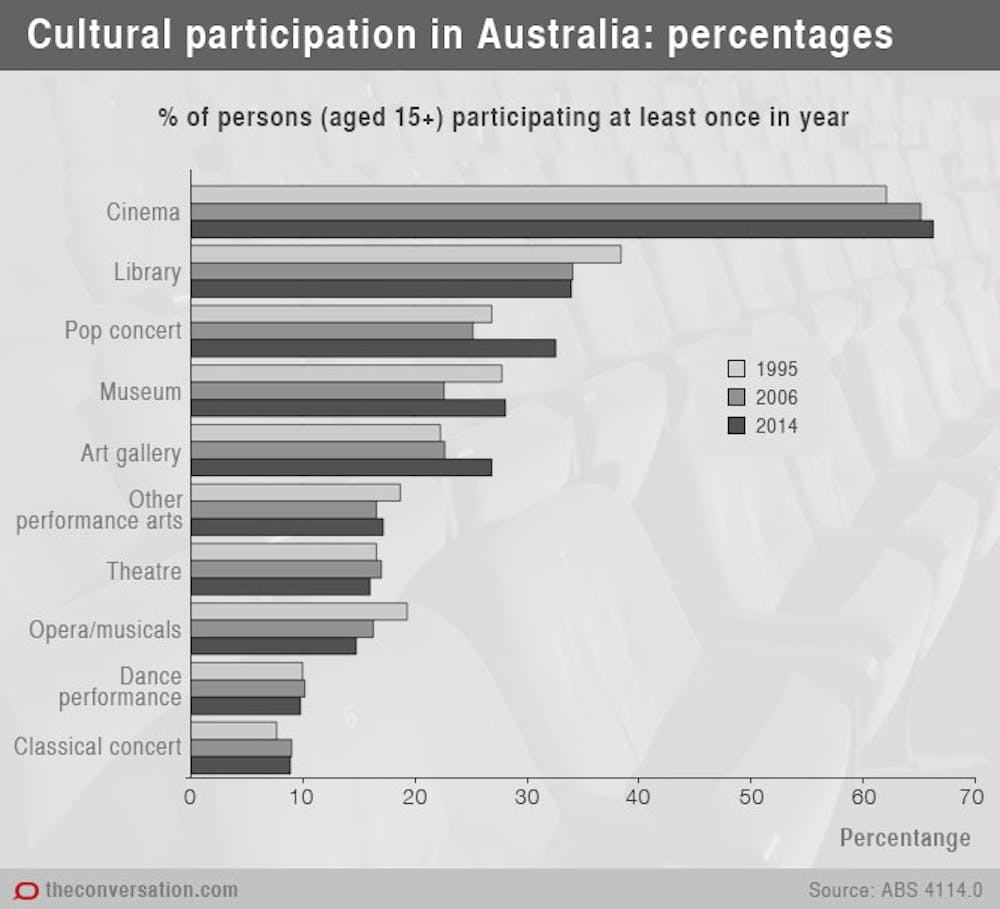
This shows that, for five out of the ten activities, the participation rate fell over the 20-year period. The decline for libraries no doubt reflects a long-term trend due to the rise of the internet, but may be balanced by increasing online access. The other four activities showing declines are all performing arts, with only classical music concerts showing an increase.
The decline for opera/ musicals is particularly striking. The earlier surveys provide separate figures for opera, indicating that it accounts for between 20% and 24% of the “opera/ musicals” figure.
It is not possible to explore here the relationship between policy and participation outcomes or the relative importance of other influences such as economic conditions and the changing demographic composition of the population.
It could of course be argued that the patterns just reflect shifting tastes: as some activities go up others go down. It is true that the positive changes more than cancel out the negative, by about 5% overall. But the worrying thing from a public policy point of view is that it is the activities supported by government funds that are losing out.
While the two commercial activities of cinema and pop concerts enjoyed a combined percentage increase of almost 10%, the other activities showed a combined net decline of 5%. Opera/ musicals is partly public sector and partly private sector: but available data on ticket sales from Live Performance Australia suggests that, from 2004 (when the data series began) to 2014, while musical theatre attendances increased slightly, opera attendances declined significantly.
The only publicly-funded activity with a significant increase was art galleries.
The Global Financial Crisis of 2008-09 did, of course, affect the cultural scene and, unfortunately, the timing of the ABS survey series meant that they were not able to track this in detail, but the trends for cinemas, pop music, art galleries and museums indicate a recovery.
Apart from the trend, the basic participation profile shown in Chart 2, above, merits comment.
How hungry are we for the arts?
In its only apparent reference to the ABS data, Creative Australia boasted:
Today, Australian audiences engage with arts and culture at an unprecedented rate. Each year, more than two thirds of adults visit the cinema; one third attend a live music event, and just more than one-quarter visit a museum or gallery.
But what if we present this information in a different way?
A third of adults do not attend the cinema in the course of a year and two thirds do not attend any sort of live music event. The figure for cinema is about what most people might expect. The music figure is perhaps disappointingly low, which may be due to cost, and may be an underestimate if classical music and opera/ musicals are taken into account as well as pop concerts.
But three quarters of adults do not visit a museum and three quarters do not visit an art gallery, even once in the course of the year, even though they are mostly free. Each of the performing arts attracts less than 20% of the population.
These low participation rates surely stand as an indictment of the effectiveness of cultural policy, the culture itself and its education system, and possibly the managements of cultural venues. It should be kept in mind that in the 20 years from 1995 to 2014, GDP per head in Australia grew by almost 50% in real terms and the proportion of the population with a bachelors degree more than doubled: there should have been a boom in all art forms.
To be fair, the condemnation should perhaps be extended more broadly to Western culture, since Creative Australia declares:
Australians are active and committed arts audiences by international standards. Recent research by the Australia Council indicates that a greater proportion of adults in Australia attend an arts event than do adults in the United Kingdom and New Zealand.