
Road infrastructure is very expensive to build, with projects like WestConnex in Sydney costing many billions of dollars and often causing political headaches. Governments therefore need to carefully assess the costs and benefits of proposed roads, and be confident they have a realistic picture of how many drivers will actually use them.
But a glance through the sad history of inflated toll road user projections in Australia shows that governments often get these numbers badly wrong.
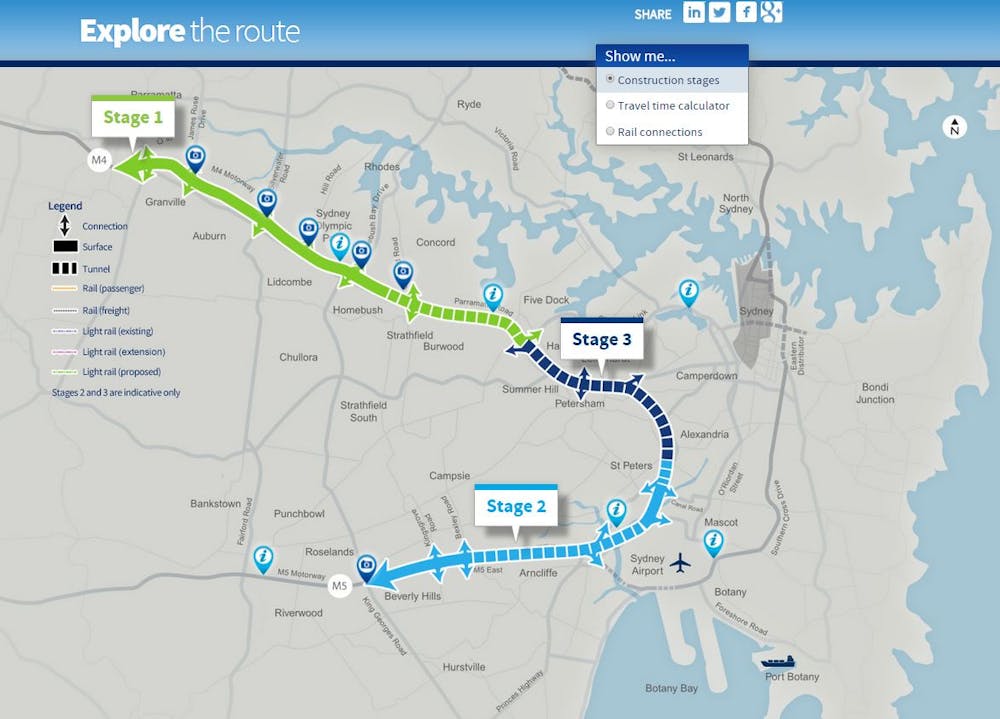
Let’s look at the example of the WestConnex Stage 3 development, a toll road shaping up to be a hot button issue in the upcoming New South Wales election.
The NSW government predicts that the WestConnex Stage 3, which links the M4 with the M5, will carry 120,000 vehicles each day by 2031 and will save each driver from Haberfield to St Peters 20 minutes travel time. So how does the government come up with these numbers? And are they realistic?
Australia’s history of getting traffic numbers wrong
A spokesperson for the WestConnex Delivery Authority told The Conversation that the projected figure of 120,000 cars a day came from WestConnex strategic traffic modelling – but that the modelling is not publicly available because it’s commercial-in-confidence.
Clearly, predicting the number of cars on a new road in the future is not an easy task, which is why governments all around the world rely on complex mathematical models to make such forecasts. These models consist of two main components, namely a travel demand model and a traffic model.
The travel demand model describes travel behaviour derived from household travel surveys and predicts the total number of cars from each origin to each destination in a future year, taking urban development and demographics into account.
The traffic model predicts how many of these cars will use each specific road segment, taking existing and newly proposed road infrastructure (and possible tolls) into account.
Australia has a history of over-predicting the usage of toll roads.
For example, the patronage of the Sydney Cross City tunnel was estimated to be almost 90,000 cars per day by June 2006. The actual number of cars using this tunnel was only 34,000 per day. Toll revenues were therefore much lower than predicted, leading to a bankruptcy after 16 months.
Similar over-optimistic predictions were made for the Lane Cove tunnel in Sydney, and for Brisbane’s Clem7 tunnel and the Airport Link, which also had financial problems.

Outdated models
So why do traffic projections in most cases turn out to be too optimistic? There are several reasons.
The first reason has to do with the travel demand model and their inputs. Since the future is uncertain, model inputs (such as population growth and willingness to pay the toll) are also uncertain, hence travel demand is uncertain.
Instead of choosing conservative inputs, often optimistic values are used due to pressures from parties who would like to see the infrastructure built. Those parties might include governments, banks and investors.
The second reason is that the most common traffic model still being used all around the world, including Australia, is based on mathematical methods from the 1950s, which are not really suitable for our heavily congested roads.
The difference between such traffic models and the real world is that these models assume that as many cars that need to can use the road, without forming any queues – even though this is not physically possible. This leads to severe over-predictions of the amount of traffic that could use each road.
Billions of dollars on the line
So how about the predicted 120,000 vehicles per day on a three-lane WestConnex Stage 3? Under ideal circumstances – which from a transport planner’s perspective is a high traffic flow without that flow breaking down –– the physically possible maximum traffic flow is around 2000 vehicles per hour per lane that can pass a road segment. This means around 12,000 vehicles per hour for a three lane road in both directions.
A traffic flow of 120,000 vehicles per day would therefore mean optimal flow conditions from 8am to 6pm. However, such optimal conditions are very unlikely, as on-ramps onto the motorway disturb traffic, leading to traffic breakdown and significantly lower traffic flows.
WestConnex is proposed to be a smart motorway with ramp metering: having a traffic light at the on-ramp that only allows a limited number of vehicles onto the motorway, which aims to avoid or delay traffic flow breakdown.
However, although a flow of 120,000 vehicles per day is theoretically possible, it is physically unlikely.
Perfect predictions of future traffic flows are not possible, but predictions of flows can be significantly improved. This means generating a more realistic travel demand using less optimistic scenarios and using more sophisticated traffic models that take physical flow constraints into account. Such more advanced models already exist and are only slightly more difficult to apply.
Given that investment decisions regarding several billions of dollars are being made, it is well worth the effort to move away from the traditional methods developed in the 1950s and adopt more contemporary methods available to governments and consultants.