
The million-dollar question at the heart of the proposed introduction of a national minimum wage in South Africa is its potential impact on the economy. This must be understood in terms of macroeconomic variables such as employment, output and growth, and microeconomic variables such as poverty and inequality.
Lessons can be drawn from international experiences. These are overwhelmingly favourable. Another approach is to undertake simulations of the local economy. The University of the Witwatersrand’s National Minimum Wage Research Initiative commissioned a statistical modelling agency to do just that.
The results are remarkably in tune with international experience: wages, household consumption and economic growth increase; unemployment rises fractionally (by 0.1% - 0.2%); and inequality and poverty fall.
This could be significant given that 50% of full-time workers earn under R3640 per month, well below the R4125 in wage income that is needed to raise a worker and their dependants out of poverty.
Scenarios
The simulation compares four scenarios against a “baseline scenario”. In the baseline scenario the trajectory of the economy over the next five years follows its existing growth path. The real growth rate oscillates around 2% and the unemployment rate around 24%.
The first scenario is a “minimalist” scenario with a national minimum wage in 2016 set at R2250, slightly above the current lower sectoral determinations. This is then adjusted for inflation each year after that.
Next, a “maximalist” scenario is simulated in which the national minimum wage is set at R6000, covering about 65% of full-time workers. It is increased annually by inflation plus 2% to close the gap that has emerged between labour productivity growth and growth in real wages.
To ease the transition this scenario includes three “tiers” for very low wage sectors. This is an established international practice. Agricultural workers earn 80% of the national minimum wage, domestic workers 70% and employees of the government’s Expanded Public Works Programme 60%.
The third and fourth scenarios are “indexed”. They benchmark the national minimum wage against a certain percentage of the average wage – also an established international practice – and gradually increase it over time.
The first indexation scenario “40%-45%” starts at 40% of the 2015 average wage for full-time workers, R3467, and increases yearly to reach 45% by 2020 (adjusted for inflation).
In the second indexation scenario “45%-50%” the starting point is 45% of the 2015 average wage for formal sector full-time workers, excluding agriculture and domestic work, an amount of R4623. This is gradually increased to 50% of the inflation adjusted average. The higher amount ensures that workers earn enough to meet their basic needs.
Likely outcomes
An integrated model was used to show the effects on both the economy as a whole, and on households. It also allows feedback effects between the two. It is an “econometric model” built on the basis of statistical (regression) analysis that captures interdependencies and interactions within the South African economy using historical time series data.
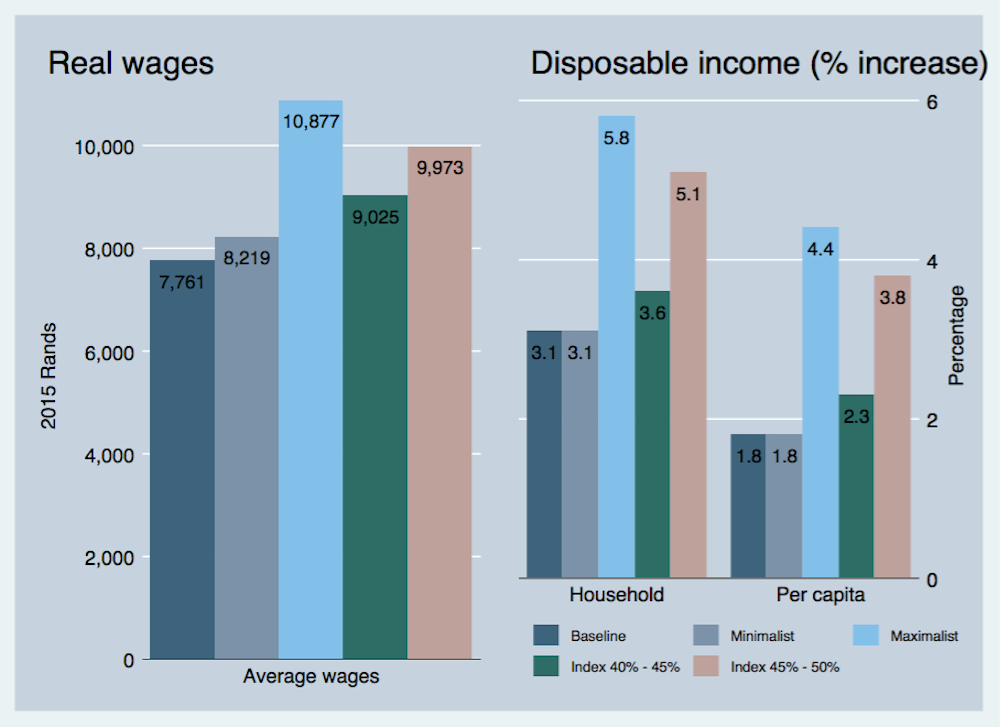
The impact on incomes is understandably positive. Figure 1 shows that average real wages for full-time employees is higher than the baseline in all other scenarios. The maximalist scenario, unsurprisingly, has the largest impact, increasing average real wages by 28% to R10 877 by 2020. The minimalist scenario produces the lowest increase, reaching R8219, just above the baseline scenario of R7779.
Given the rise in wages we see an increase in per capita and household disposable income. Again, the indexation scenarios fall between the minimalist and maximalist positions with the 45%-50% indexation scenario producing average annual increases of 5.1% and 3.8% to per capita and household disposable income respectively.
Figure 1: Real wages and average annual increases to disposable income (2016 – 2020)
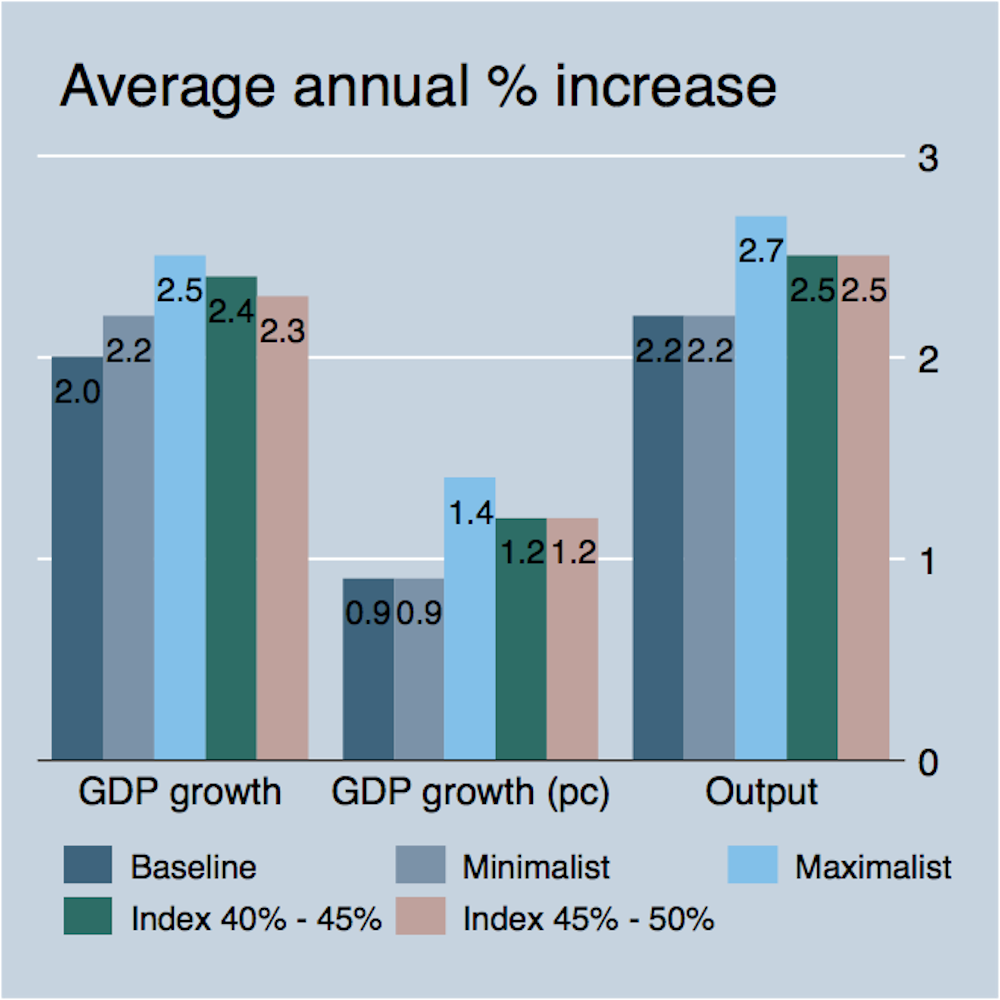
The rise in incomes stimulates growth through increased spending as shown in Figure 2. Real GDP growth in the baseline scenario averages at only 2% but rises to between 2.2% and 2.5% with the institution of a national minimum wage. Unsurprisingly, the average annual percentage increase to output is above the baseline in all but the minimalist scenario, and sits at 2.5% for both indexation scenarios.
Figure 2: GDP and output growth (2016 – 2020)
The impact on labour productivity and unemployment rate is shown in Figure 3. The minimalist scenario has no negative impact on employment. The maximalist scenario lifts unemployment 0.2% higher than the baseline.
Both indexation scenarios result in an unemployment rate of 25.8%, which is 0.1% higher than the baseline. This very slight increase in unemployment fits the pattern observed internationally. It is a minor trade-off when considering the significant increases to household income (shared with the unemployed) and positive growth effects. In all scenarios labour productivity increases marginally.
Figure 3: Average rates of labour productivity and unemployment (2016 - 2020)

Poverty and inequality
Tackling poverty and inequality are national priorities and objectives of instituting a national minimum wage. We should recall that inequality between income earners (and not unemployment) is the main driver of inequality.
The modelling excercise gives us cause for optimism.
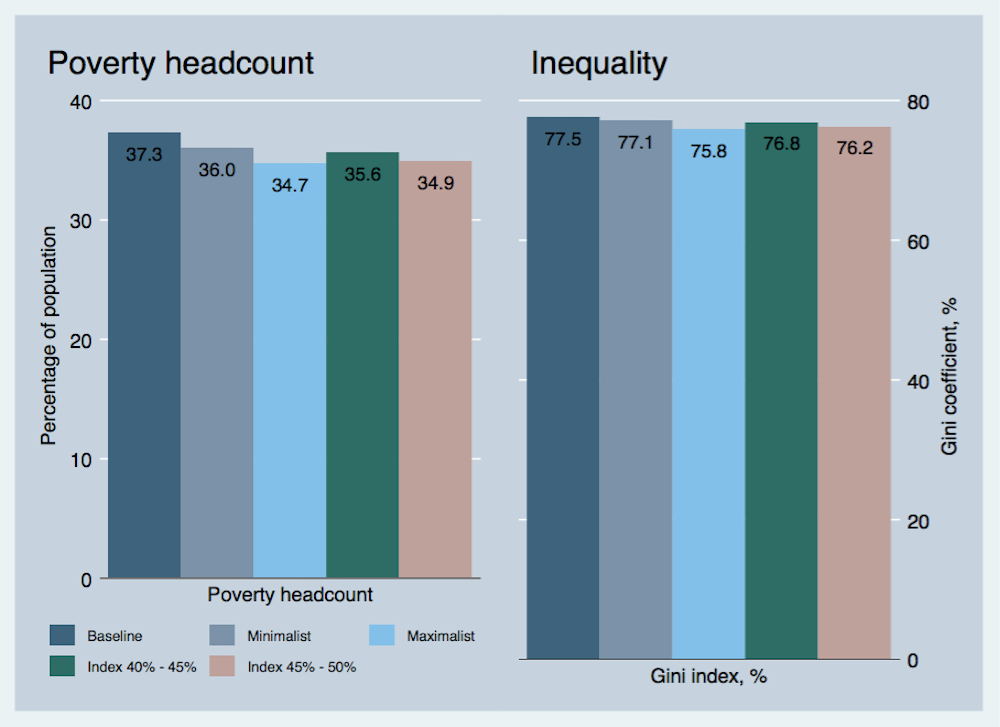
In Figure 4 the baseline projection for the “poverty headcount” – the percentage of the population defined as poor – is 37.3%. This decreases in all scenarios after the institution of a national minimum wage. The most dramatic decrease, of up to 2.6 percentage points, is in the scenarios with higher national minimum wages.
Similarly, instituting a national minimum wage results in a decline in inequality. The magnitude of this is directly related to the level, with a low national minimum wage in our minimalist scenario having the least impact.
These decreases are not huge but they are significant. They reveal the potential of a national minimum wage.
Figure 4: Poverty and inequality (2020)
Lessons
Modelling is not a perfect prediction. A range of economic and political events could throw these estimates off. But what can be neatly compared is the difference between the baseline “business as usual” scenario and the introduction of a national minimum wage in various forms.
This exercise shows, differentiation notwithstanding, that a national minimum wage set at levels high enough to meet workers’ basic needs can have a positive impact on wages, consumption, growth, poverty and inequality, without dire consequences for employment or inflation.
This article is based on a research by Dr Asghar Adelzadeh, Director and Chief Economic Modeller at Applied Development Research Solutions. Dr Adelzadeh was commissioned by the National Minimum Wage Research Initiative.