

The release of the Finkel report has refocused national attention on climate change, and how we know it’s happening.
On a Q&A episode following the report’s release, Climate Council CEO Amanda McKenzie said we’ve seen:
… worsening heatwaves, hot days doubling in Australia in the last 50 years.
Her comment provides the perfect opportunity to revisit exactly what the research says on heatwaves and hot days as Australia’s climate warms.
Examining the evidence
When asked for sources to support McKenzie’s assertion, a Climate Council spokesperson said:
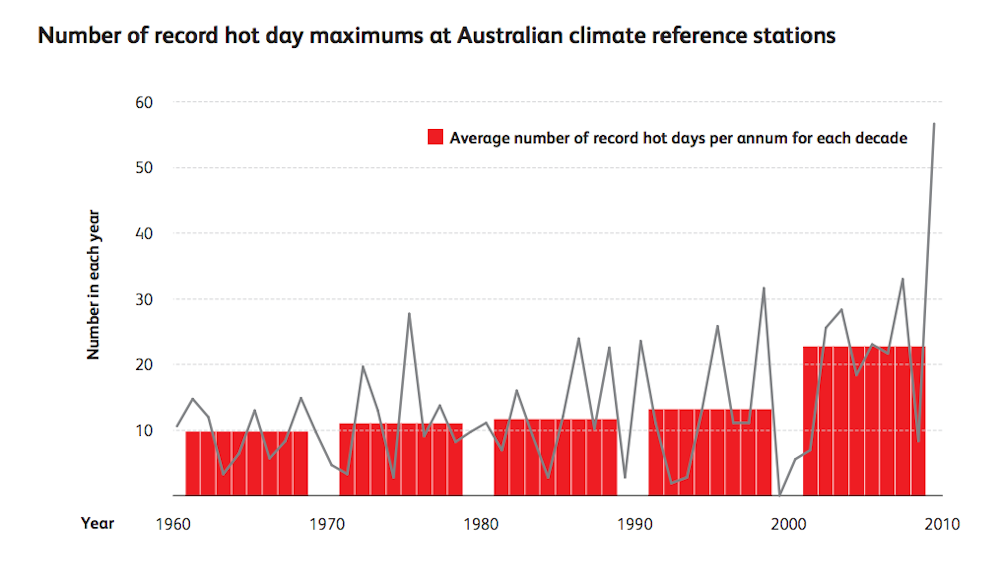
Climate change is making hot days and heatwaves more frequent and more severe. Since 1950 the annual number of record hot days across Australia has more than doubled and the mean temperature has increased by about 1°C from 1910.
Specifically, there has been an increase of 0.2 days/year since 1957 which means, on average, that there are almost 12 more days per year over 35°C.
You can read full response from the Climate Council here.
How do we define ‘heatwaves’?
Internationally, organisations use different definitions for heatwaves.
In Australia, the most commonly used definition (and the one used by the Climate Council) is from the Bureau of Meteorology (BOM). It provided the first national definition of a heatwave in January 2014, describing it as:
A period of at least three days where the combined effect of excess heat and heat stress is unusual with respect to the local climate. Both maximum and minimum temperatures are used in this assessment.
The BOM uses a metric called the “excess heat factor” to decide what heat is “unusual”. It combines the average temperature over three days with the average temperature for a given location and time of year; and how the three day average temperature compares to temperatures over the last 30 days.
We can also characterise heatwaves by looking at their their intensity, frequency and duration.
Researchers, including Australian climate scientist Dr Sarah Perkins-Kirkpatrick, are trying to standardise the definitions of “heatwaves” and “hot days” and create a framework that allows for more in-depth studies of these events.
Are heatwaves ‘worsening’?
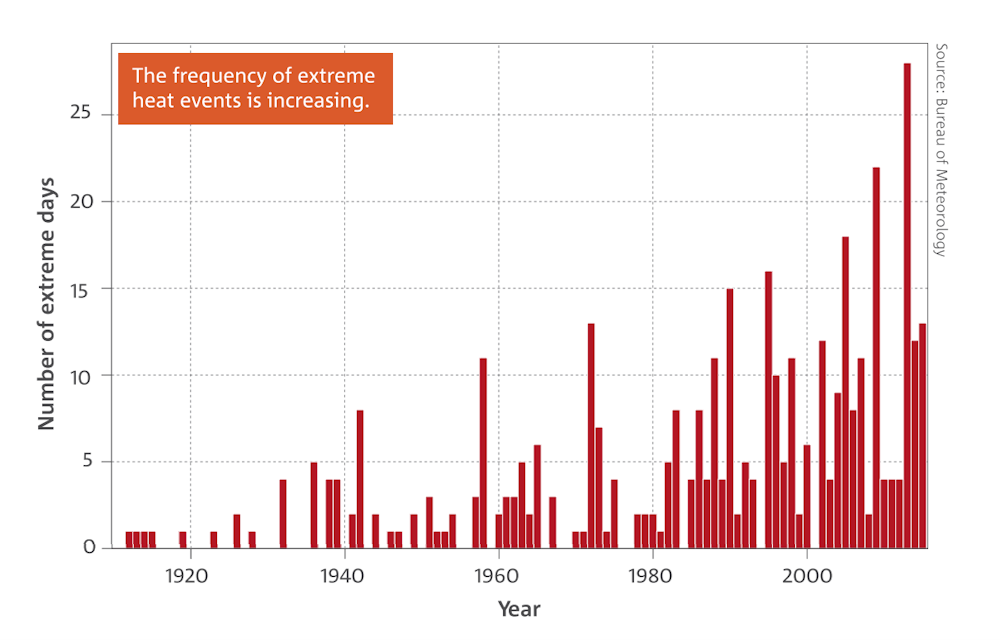
There’s not a large body of research against which to test this claim. But the research we do have suggests there has been an observable increase in the frequency and intensity of heatwaves in Australia. Research published in 2013 found a trend towards more heat waves in Australia between 1951 and 2008.
A review paper published in 2016 assessed evidence from multiple studies and found that heatwaves are becoming more intense and more frequent for the majority of Australia.
The following chart shows heatwave days per decade from 1950 to 2013, highlighting a trend toward more heatwave days in Australia over time:
Have hot days ‘doubled’ in the last 50 years?
While the number of “hot days” (as defined by the BOM) has not doubled over the last 50 years, as McKenzie said, the number of “record hot days” certainly has. “Record hot days” are days when the maximum temperature sets a new record high.
Given that McKenzie made her statement on a fast paced live TV show, it’s reasonable to assume she was referring to the latter. Let’s look at both figures.
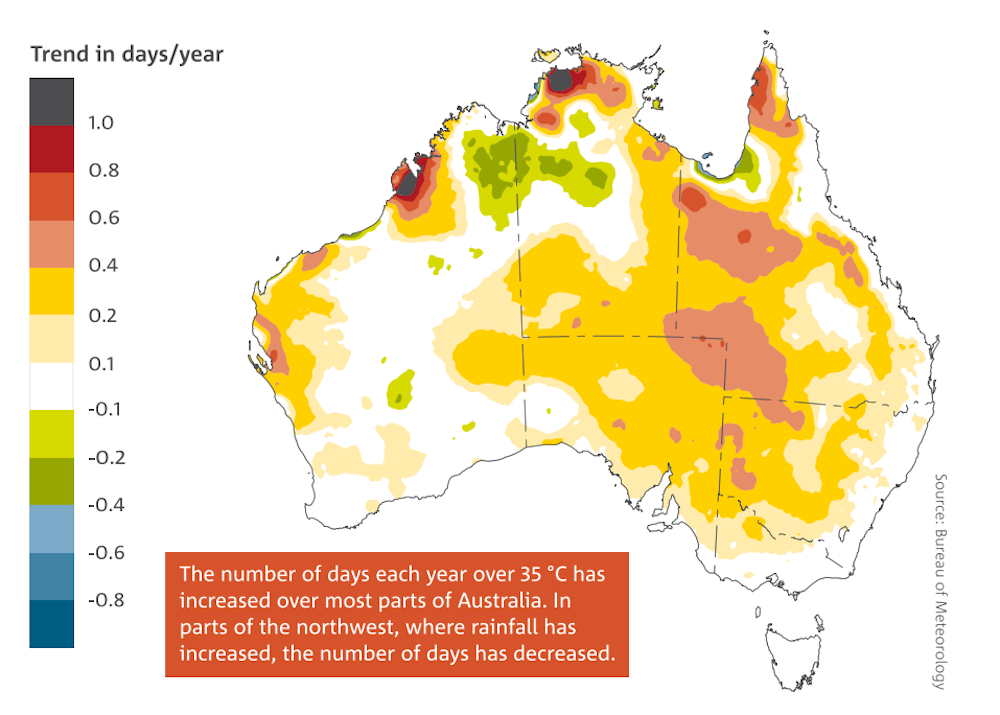
The BOM defines “hot days” as days with a maximum temperature higher than 35°C. The BOM data show there were more hot days in Australia in 2013, 2014, 2015 and 2016 than in any of the 50 years from 1966 to 2016 (the last year for which data are available).
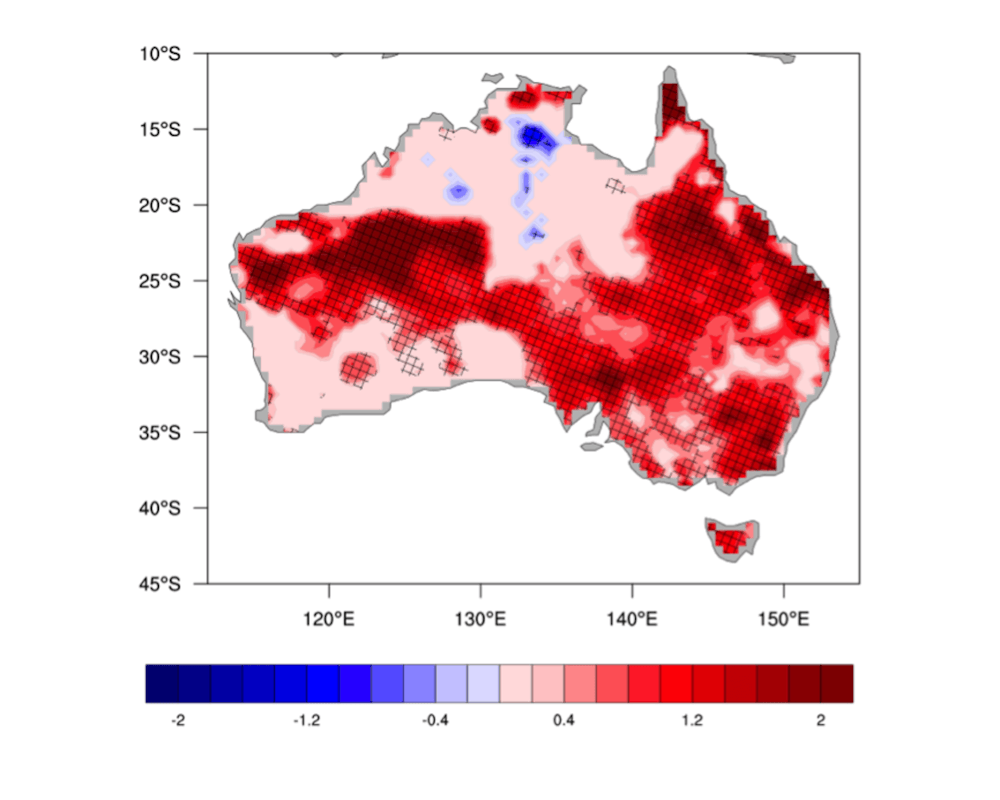
In fact, there were more hot days in the years 2013-2016 than in any other year as far back as 1910. If we compare the decades 1966-76 and 2006-16, we see a 27% increase in the number of hot days.
The following map shows the trend in the number of days per year above 35 °C from 1957–2015:
A 2010 Bureau of Meteorology/CSIRO report found record hot days had more than doubled between 1960 and 2010. That data was collected from the highest-quality weather stations across Australia.
Why are heatwaves worsening, and record hot days doubling?
The trend in rising average temperatures in Australia in the second half of the 20th century is likely to have been largely caused by human-induced climate change.
Recent record hot summers and significant heatwaves were also made much more likely by humans’ effect on the climate.
The human influence on Australian summer temperatures has increased and we can expect more frequent hot summers and heatwaves as the Earth continues to warm.