


And for the record, despite Labor’s scare campaigns, the Coalition is investing an average of $5 billion more per year into Medicare than Labor did. – The Liberal Party of Australia’s Medium page, June 19, 2016.
The Liberal Party has said that it is investing $5 billion more per year on average into Medicare than Labor did.
Is that right?
Checking the source
We asked the Liberal Party to provide the sources of the statement but we did not receive a reply before publication. However, we can test this against the available data that tracks Medicare expenditure.
The meaning of ‘Medicare’
One major uncertainty in the claim is that there are different definitions of what constitutes Medicare.
The two major areas we are focusing on as representing Medicare expenditure are the Medicare Benefits Schedule (MBS) and the Pharmaceutical Benefits Schedule (PBS). The MBS covers expenditure on medical services, and includes things like professional attendances, diagnostics and therapeutic procedures, while the PBS pays for drugs. The government budgetary definition of Medicare spending is only for the MBS. However, we believe the PBS is likely to be contained within the Liberal Party figure of $5 billion.
One area we are assuming is not included is state spending on public hospitals; if we were to include this, it may increase the difference in total spending between the two periods.
Below, the term PBS refers to both the PBS and the Repatriation Pharmaceutical Benefits Schedule (RPBS), which provides for certain classes of Department of Veterans’ Affairs beneficiaries.
Tracking annual spending on the MBS, PBS and RPBS
We therefore take the statement by the Liberal Party to mean that the sum of MBS, PBS and RPBS expenditure has increased by an annual average of $5 billion – but note the uncertainty in the definition.
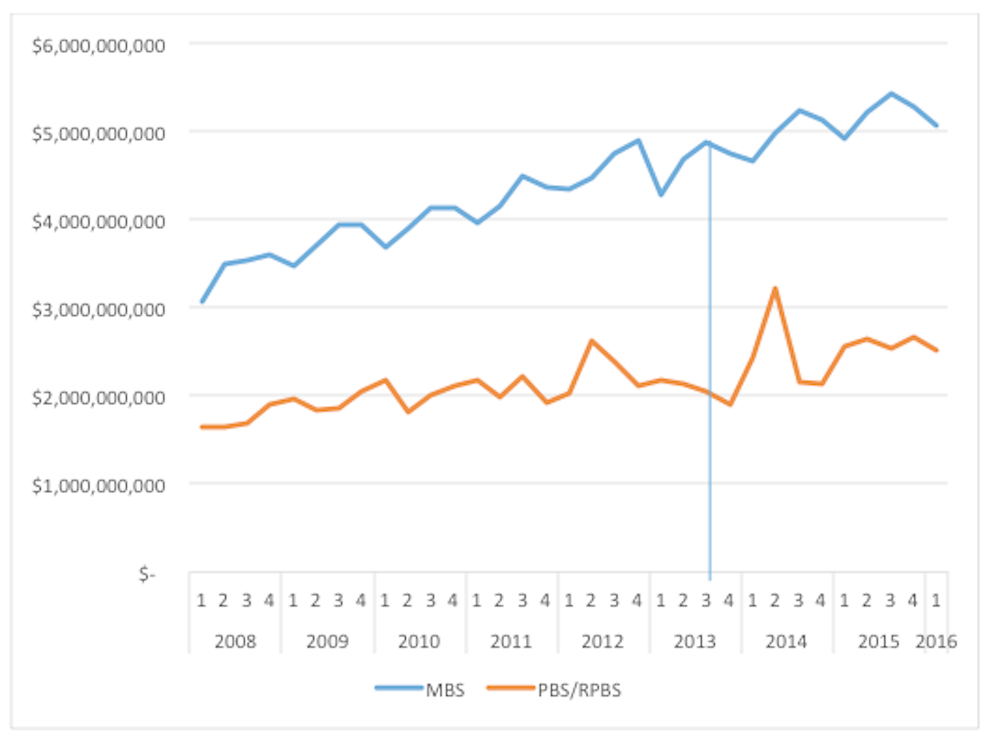
The Department of Human Services provides month by month figures on government expenditure for the MBS, PBS and RPBS.
Aggregate figures for this are shown below by quarter since January 2008 until the most recent complete quarter (ending March 2016). The transition point between the second Rudd government and the Abbott one is marked approximately on the graph with the vertical blue line.
Medicare spending under Labor
Labor was in power between December 3, 2007, and September 18, 2013. To approximate this period, we used data from January 1, 2008 to September 30, 2013 to represent Medicare expenditure under the Labor government. (We used January 1 rather than the December 1 as some data sources report quarterly data, and January 1 lines up with this.)
Over the period of the Labor government, total PBS/RPBS spending was $46.577 billion, and total MBS spending was $93.931 billion. This comes to $140.508 billion, which on an annual basis (based on a figure of 5.75 years to represent the period Labor was in power), is an average spend of $24.436 billion per year.
Medicare spending under the Coalition
For the period between October 2013 and May 2016 (representing the period when the Coalition has been in power), total spending under the MBS was $54.448 billion, and total PBS/RPBS spending was $26.713 billion.
This totals $81.161 billion over two years and eight months, or $30.435 billion per year.
So, using our definition of what constitutes Medicare, the difference between the average annual Medicare spend under Labor and the average annual Medicare spend under the Coalition is about $5.999 billion per year.
Using these data, the claim made by the Coalition is true.
Context matters
However, it is not clear whether this increase in spending represents either an increase in spending per person, or an increase in service delivery. All we know so far is that the total dollar amount is bigger.
The Australian population has increased between the two time periods, meaning the per capita Medicare expenditure will not have increased at quite the same impressive-sounding rate as the raw figure of an average of $6 billion per year.
The second factor to consider is the rising cost of health care.
After adjusting for inflation and population growth, the average extra Medicare expenditure will be more modest than that indicated by the raw figures. And health costs are rising faster than inflation.
In other words, more Australians than before are accessing Medicare and most unit costs are likely to have, on average, risen.
Verdict
Without knowing the source for the Liberal Party’s claim, it was difficult to know what its “average of $5 billion more per year” claim was based on.
Assuming the claim refers to the sum of MBS, PBS and RPBS spending, the Liberal Party is correct.
Using our definition of what constitutes Medicare spending, the difference between the average annual Medicare spend under Labor and the average annual Medicare spend under the Coalition is about $6 billion per year.
However, care must always be taken drawing conclusions from the raw dollar amounts, since they do not take into account changing population size and inflation. – Richard Norman and Rachael Moorin
Review
The authors have valiantly attempted to fulfil a tricky brief because of the ambiguity of the claim. It is a sign of Australia’s complex health care system when we can’t even be precise about what constitutes Medicare funding.
As noted by the authors, there are different definitions of what constitutes Medicare. Here, the authors have assumed it means spending on the MBS and PBS/RPBS. On this basis they compare average annual MBS/PBS funding during the Gillard/Rudd era with funding during the Abbott/Turnbull era. The authors find that the Liberal Party has underestimated the additional annual spent by around $1 billion.
However, if we restrict the claim to Medicare spending only (excluding PBS/RBS spending), the average annual difference between the Abbott/Turnbull and Gillard/Rudd era is $4.13 billion - which implies that the claim is exaggerated by about 21%.
Under a broader definition of Australian government health spending, Budget Outcomes data reveals totals of $62.012 billion (2011-12), $61.302 billion (2012-13), $63.983 billion (2013-14) and $65.696 billion (2014-15). Under this definition, and comparing the last two years of the Gillard/Rudd era with the first two years of Abbott era, the increase in annual health funding is substantially less than $5 billion.
This brings us to the futility of the claim itself. I agree with the authors that the claim needs be considered in the context of population growth and price increases. After taking these two factors into account, expenditure has increased by a modest amount. While funding health care is an important issue, the claim made by the Liberal Party says nothing about whether the additional funding is delivering greater access to better health care. – Kees Van Gool