

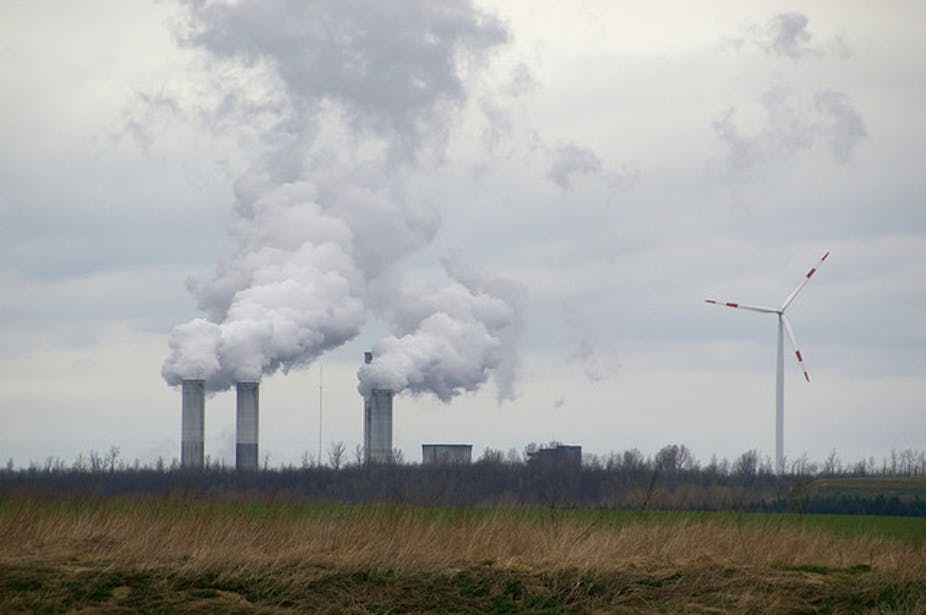
In our Conversation article, King Coal dethroned, we suggested that renewable energy investment was now outstripping fossil fuel power investment.
Many welcomed the news that the future was arriving sooner than they had expected. A few responses suggested the data was not right. Others argued it couldn’t possibly be right as it conflicted with their whole understanding of how the energy system worked. It undermined their belief in the “unchallengeable” dominance of fossil fuel power and the “inadequacies” of renewables.
We would suggest that its time to see the mythologies about coal-fired power and renewables put to rest by good data so we can get on with the 21st century.
Let’s double-check those figures for Australia…
We gave two sets of data - one on Australia and one on global energy - both showing a dramatic increase in the market for renewables.
The Bureau of Resources and Energy Economics’ (BREE) publication, Major Electricity Generation Projects, did indeed show that in 2011 electricity investment in projects totalling 2668 MW capacity was coal 17%, gas 36%, and wind 41%. BREE only considers commercial projects in excess of 30 MW, so small-scale generation such as roof-top solar or small solar farms are not included in the data.
A new report was released by the Australian PV Association (APVA) after our article was published. It reveals a total of 837 MW of PV was installed in Australia in 2011, capacity not considered in the BREE publication. Add 2668 MW from BREE to 837 MW from APVA and we find solar delivered an amazing 25% of new installed capacity in Australia in 2011. Revised proportions for the other generation is gas 29%, wind 33% and coal 14%. Renewables added a remarkable 58% of all electricity generation capacity in Australia in 2011.
King Coal is well and truly on the way out. What’s more, renewables now make up over half of all new power being generated in Australia.
There is a major challenge in Australia, and globally, to understand the rapidly changing scene of energy investment toward sustainable energy. The agencies responsible for reporting these metrics are not reporting the whole picture, because the conventional view of energy markets doesn’t consider you can generate a lot of electricity on homes.
…and for the rest of the world
The global data can also be confirmed, though it’s not quite as simple. A major source for the global data is Bloomberg New Energy Finance (BNEF) who first showed that in 2008 there had been a higher amount of investment in renewables than in fossil fuel. BNEF have done several revisions since and found a dramatic three-fold increase between 2004 and 2008 in renewables investment. There was a plateau for 2009 and then a further increase in 2010 and 2011 (see Figure 1). This is real data rigorously collected by BNEF.
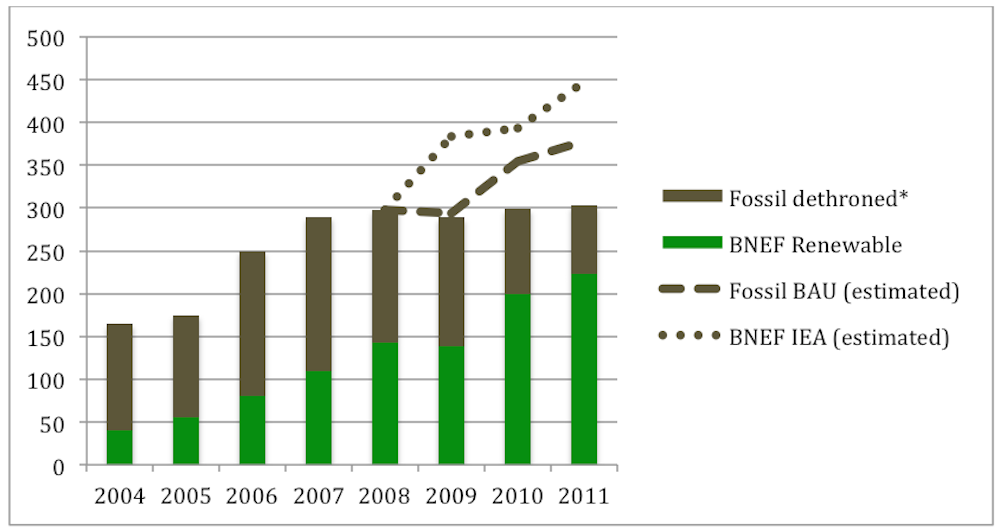
But how do you compare this to fossil fuel investment? The usual source is the International Energy Agency (IEA). BNEF have been using data from IEA to suggest that fossil fuel investment has shot back up to outstrip renewables, unaffected by the 2009 Global Financial Crisis (GFC), and actually surging in 2010 and 2011. This is presented as the IEA (estimated) line in Figure 1.
If the source of the data is pursued as we did, asking BNEF where this sudden turn back to fossil fuels came from, we discover that the recent data has not yet been collected – that the investment projections from BNEF are derived on the basis of 2008 IEA capacity growth projections.
The optimistic projections for fossil fuel power investment are proving to be wrong in several specific cases where real data are available. For example, the IEA forecast in 2008 that there would be 64 GW of coal power built by 2011. According to the US National Energy Technology Laboratory (NETL) the actual number was just 16 GW; this is an updated and slightly increased number from the 14 GW we reported in King Coal Dethroned.
Even if we consider a more modest scenario – the global investment market for traditional energy remained business-as-usual (BAU) while allowing a 2009 GFC dip, and discrete from the overall pool of monies available from funding institutions and unaffected by clean tech investment – we still won’t reach anything like the projections made by the IEA (see Fossil BAU – Figure 1).
In King Coal Dethroned we assumed the competitive pool of investment funds available for constructing electricity projects for the past five years has been around $300 billion globally. Thus we calculated fossil fuel in recent years as the difference after considering the renewables data. Our conclusion was that fossil investment is getting smaller and not larger as projected by the IEA.
We contend that the numbers for fossil fuel investment presented by BNEF based on the IEA numbers is grossly overstated.
We’re not using as much power
To support our case that the IEA projections will prove to grossly overestimate fossil fuel constructions, we would add the following evidence.
Electricity consumption has peaked around the world, including:
in all states of Australia, with the earliest falls in Victoria and New South Wales as a consequence of long-running programs in those states to help householders reduce electricity consumption
in Canada
in Scotland,
in Europe (allowing for a strong dip during the GFC)
globally, where it peaked around 2007/2008 and has fallen every year since then - even from coal – from IEA data.
A good proportion of falls in electricity consumption globally over the last few years can be attributed to improving energy efficiency across the domestic, commercial and industrial sectors. These are the result of successful regulatory intervention from governments wanting to reduce emissions.
If the world does not need as much electricity, why then would it suddenly start investing more than ever in fossil fuel electricity generation?
Businesses are changing the energy they invest in
The latest data released by REN21 on 11 June 2012 in their Renewables Global Status Report shows that around half the 208 GW of new electric capacity installed globally in 2011 was renewable.
This too runs counter to estimates that portray a scenario of larger investments in fossil fuel generation in the same year. While renewable projects continue to get cheaper, renewables cannot quite match dollar-for-dollar capacity costs of conventional energy generation – at least not quite yet.
So, we think our lower-end numbers are far more realistic, and that the pool of funds for investment in renewable and non-renewable energy projects are not independent. Businesses have been changing the forms of energy they invest their funds in. We won’t know the real data for 18 months but we would suggest that what we are seeing is what Michael Liebrich from BNEF calls a “… fundamental re-engineering of the world’s energy architecture around low carbon, more distributed, more secure solutions”.
Renewables are becoming cheaper, more reliable and more widespread
Many of the responses that challenged our article, and media discussions of the findings, simply said it could not be right. Coal is always the cheapest and renewables are inherently more expensive and unreliable, so they will not work in our grids. Some often went further and blamed rising power costs on renewables.
We would suggest this is simply wrong. The following data support the contention that renewable energy is rapidly being deployed both globally and within Australia. It is not expensive, especially when compared to peak power (a key contributor to increasing power costs over the past decade):
Solar PV attracted more than half of all clean energy investments in 2011, fetching $128 billion — up 44% from 2010. Installations were up 54% to 29.7 GW.
In 2011, 27.7 GW of new PV capacity was installed globally, with Europe accounting for around three-quarters (20.9 GW) of all new capacity, with total global installed solar capacity reaching 70 GW.
German solar power plants produced a world record 22 gigawatts of electricity – equal to 20 nuclear power stations at full capacity – through the midday hours of Friday and Saturday, and met nearly 50% of the nation’s midday electricity needs
According to the Australian PV Association, a total of 837 MW of PV were installed in Australia in 2011, more than twice the capacity added in 2010. Total installed capacity in Australia is now 1.4 GW.
The Australian Energy Market Operator (AEMO) forecasts at least 5 GW of solar in Australia by 2020
On-shore wind reduced in cost globally by 14% and has now reached grid parity in many parts of Australia.
Solar PV has reduced in cost 78% since 2008 and 45% in the past year.
Indeed, in this last report, BNEF go on to explain “current PV costs and the associated market and technological shifts witnessed in the industry have not been fully noted by decision-makers. The perception persists that PV is prohibitively expensive, and still has not reached ‘competitiveness’”.
The new paradigm that helps to explain the “fundamental re-engineering of the world’s energy architecture” is that renewables, especially PV, are producing power right where it is needed. There is no elaborate distribution system needed; no poles and wires and sub-stations that push the power up in voltage to send it over long distances and then brings it down in voltage for the user. In electricity, network costs are the largest component accounting for 50-60% of the cost of electricity. Distribution costs have contributed almost 2/3 of price rises over recent years.
Last week the City of Sydney took the next step, introducing a power system to the CBD no longer dependent on coal from the Hunter Valley. Based on gas and renewables, the system will save 80% of the greenhouse gas in the present system and will be cheaper for businesses as it does not need the expensive distribution system.
Why wouldn’t you do this if new technologies allowed it?
These new sustainable energy systems are rapidly being adopted across the world. They will continue to demonstrate that the inevitable continued growth of coal, and the unfortunate cost and impracticality of renewables, are in reality just myths.