Data science infrastructure is sorely needed in many places. Doctors Without Borders brings medical help to nations in need, but similar efforts are relatively small for statistics.
One in a million or one in ten? Mathematics can help us work out the odds of whether recent sightings of UFOs are really alien spaceships.
A November 2020 memorial in Washington, D.C. consisted of thousands of flags, each planted to remember someone who died of COVID-19.
Andrew Lichtenstein/Corbis via Getty Images
Record-keepers have a pretty good sense of how many people have died. But figuring out the cause of those deaths is a lot trickier – and that’s why reasonable modelers can disagree.
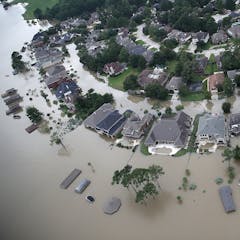
Socioeconomic and cultural data can help governments predict and slow the spread of the next pandemic.
Spencer Platt/Getty Images
Understanding numbers in the news or social media can empower you to figure out risks and make good choices. Here’s what to look out for to make sure you aren’t misled by COVID-19 coverage.
It’s important to get the figures right to know if we are truely out of any recession, or if we need further stimulus to help get more people into work.
We can speed up our coronavirus response using statistics.
Jane Barlow/PA
Smart people can have really bad ideas – like selectively breeding human beings to improve the species. Put into practice, Galton’s concept proved discriminatory, damaging, even deadly.
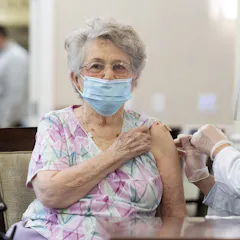
By mid-January, only about a quarter of the COVID-19 vaccines distributed for U.S. nursing homes through the federal program had reached people’s arms.
Paul Bersebach/MediaNews Group/Orange County Register via Getty Images
Whether you are predicting the outcome of an election or studying how effective a new drug is, there will always be some uncertainty. A margin of error is how statisticians measure that uncertainty.
On Dec. 8, 2020, the first members of the public were given doses of a coronavirus vaccine.
AP Photo/Frank Augstein, Pool
The coronavirus vaccine was developed faster than any vaccine in history. It took just 332 days from the first sequencing of the virus genome to the first vaccines given to the public.
Asking these four questions can help us identify good news when we see it, be more critical of news reports, or delay our judgement until we have more information.
Professor, Future Fellow and Head of Statistics at UNSW, and a Deputy Director of the Australian Centre of Excellence in Mathematical and Statistical Frontiers (ACEMS), UNSW Sydney