
Something strange is happening within the world-famous pitch drop experiment with the latest drop forming much faster than the last couple of drops.
There have been nine drops so far and all attention is now on trying to observe the tenth, expected sometime in the 2020s.
The actual experiment began in October 1930 and is now recognised by Guinness World Records as the longest-running laboratory experiment – and in all that time no one has ever witnessed a single drop of pitch to fall.
But what started as a simple lecture demonstration has captured the interest of tens of thousands of people worldwide.
In the beginning
The experiment’s creator and its first custodian was Professor Thomas Parnell, the first professor of physics at The University of Queensland. In 1927 he setup the experiment to demonstrate the viscosity of pitch – the thickest fluid known to exist.
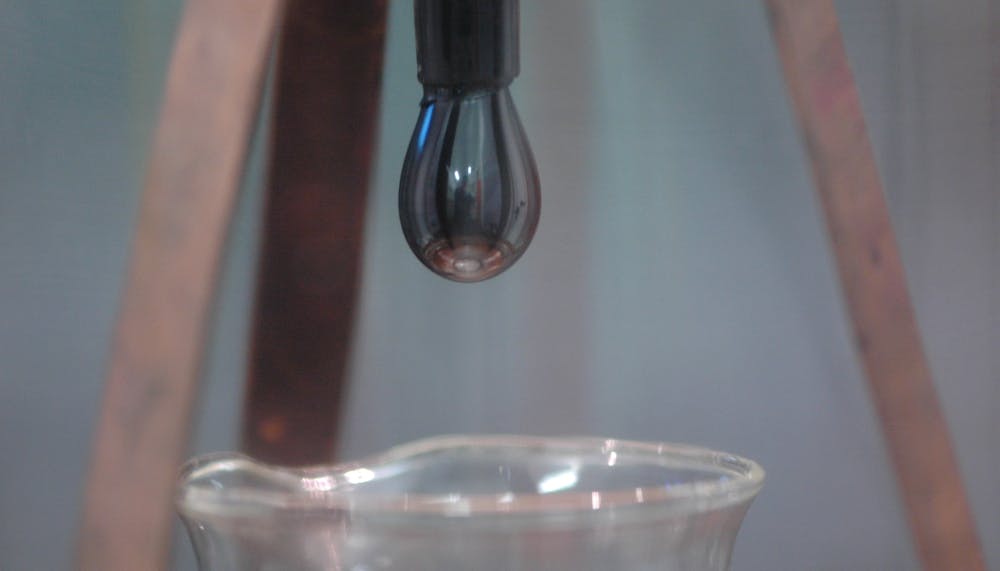
Professor Parnell heated some pitch and poured it into a glass funnel, then left it to cool for three years. In October 1930 the bottom of the funnel was cut and the pitch began to flow.
It took eight years for the first drop to fall. The next five drops each took seven to nine years to fall, with the sixth drop falling in April 1979.
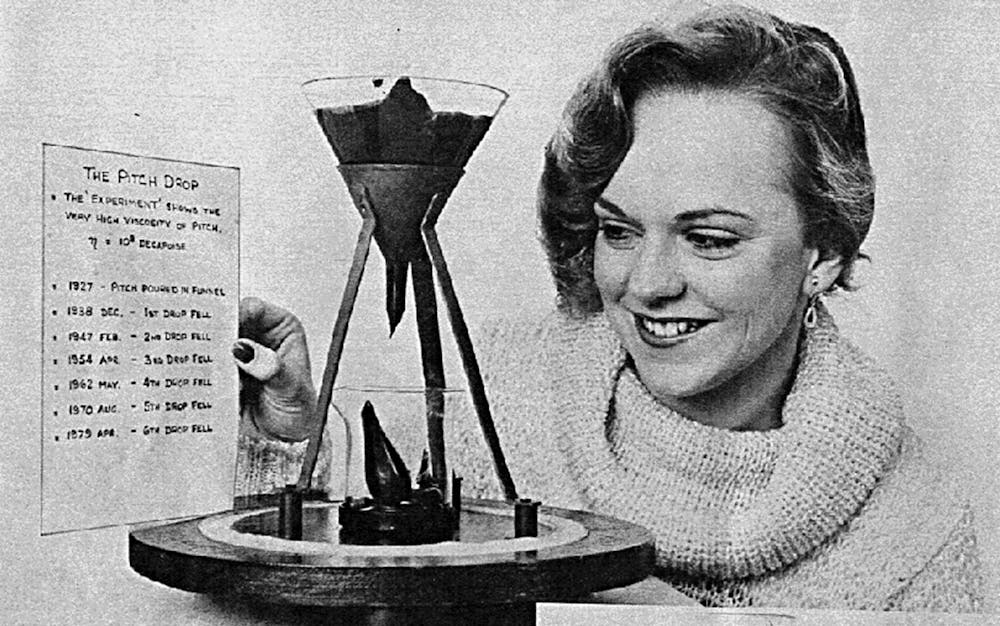
The seventh drop fell in July 1988 – nine years after the sixth drop – and it look liked the pitch drop experiment had revealed all it had to offer.
But rarely does science go to plan. In what could be described as relatively recent times the pitch drop experiment has become far less predictable.
The troublesome eighth drop
The eighth drop took more than 12 years to fall. No one was quite sure why it took so long. Perhaps it was due to decreasing pressure from the ever-diminishing mass of pitch remaining in the funnel.
Another explanation was that the building housing the pitch drop experiment had been renovated in the 1980s and it was thought that the newly installed air-conditioning was cooling the experiment down, thus making the pitch more viscous.
Evidence supporting this hypothesis was the physical size of the eighth drop, which was noticeably larger than previous drops.
It was hoped that the ninth drop might shed some light on this puzzle, but as the ninth drop began to descend it ran into the tail of the eighth drop sitting in the beaker below.
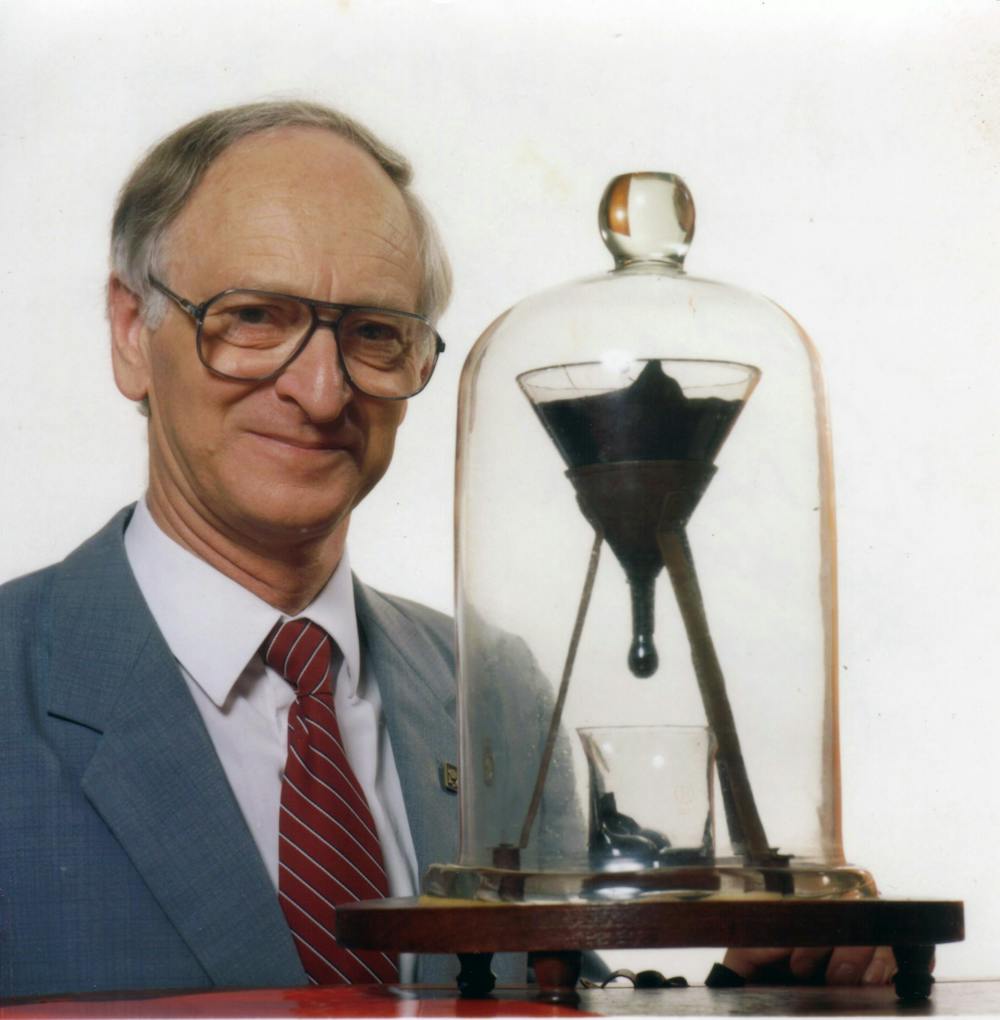
Rather than altering the experiment, Professor John Mainstone – the pitch drop’s second custodian – thought it best to leave the pitch drop as Professor Parnell had created it to see what would happen.
After a decade it was apparent that the ninth drop was bigger and falling slower than the first seven drops. But this didn’t help solve unanswered questions as the experimental conditions had changed – the ninth drop was being supported by the eighth.
Such is the nature of science that more spanners were found to have been thrown in the works. At the start of 2012 I arranged for a video camera to record the pitch drop experiment and make a time-lapse video so that it would be possible to actually see the pitch falling.
By mid-2013 it became apparent that the ninth drop wasn’t going to actually drop – rather it was going to make a gentle touchdown.
Although it was disappointing knowing that the ninth drop wasn’t going to fall, the pitch drop was still providing new insights. The stem of the eighth drop was buckling and breaking, the time-lapse was revealing that the ninth drop’s descent was accelerating and there was still the goal of being the first person in history to witness a drop of pitch come to its end.
Still no witnesses
Since the pitch drop experiment began in 1930 no one has ever seen the pitch actually drop. Professors Parnell and Mainstone knew the date of drops simply because the drop was attached one day, and had fallen the next.
A computer and camera were set up to capture the eighth drop in 2000, but an unfortunately-timed blackout prevented the drop from being recorded.
Although the ninth drop wasn’t actually going to fall there was a lot of interest from around the globe (31,335 people from 158 countries registered to view a live video stream) as to the exact moment the ninth drop would touch down.
With the time-lapse camera I had set up, which was also recording continuous video of the four most recent days, and two additional video cameras that were set up in anticipation of the ninth drop’s demise it was thought the exact moment of touch down would be known for the first time in history.
But the pitch drop experiment had other plans.
When something, such as water or pitch, drips the drop starts with zero velocity, then freefalls accelerating at 9.8m/s2, and comes to a stop when it crashes to the ground.
Determining when this happens is easy because of the noticeable changes in velocity. Unfortunately, the ninth drop wasn’t going to freefall, so it wouldn’t have a sudden increase in speed.
Making matters worse was the fact that the ninth drop wasn’t landing squarely on top of the eighth drop – it was going to make a glancing blow and continue to descend after touching down.
This meant that determining the moment the ninth drop touches down was a matter of noticing its rate of descent change from an incredibly slow velocity to an even slower one.
No one on earth could possibly hope to see when that change occurred. The best guess of observers initially had the time of touchdown to within a four-day period of April 11-14 2014.
It was hoped that touchdown could be seen in the time-lapse video – which was constructed from a series of still images taken once per day thereby speeding up the movement two million times.
Unfortunately the eighth drop was slightly closer to the camera than the ninth drop, making their point of contact obscured from view. But with analysis of the time-lapse it is possible to determine the date of touchdown.
In an analysis by Dr Anthony Jacko and myself the plot (below) shows the position of the drop April 4-23. The slope of the data indicates the speed at which the pitch is descending.
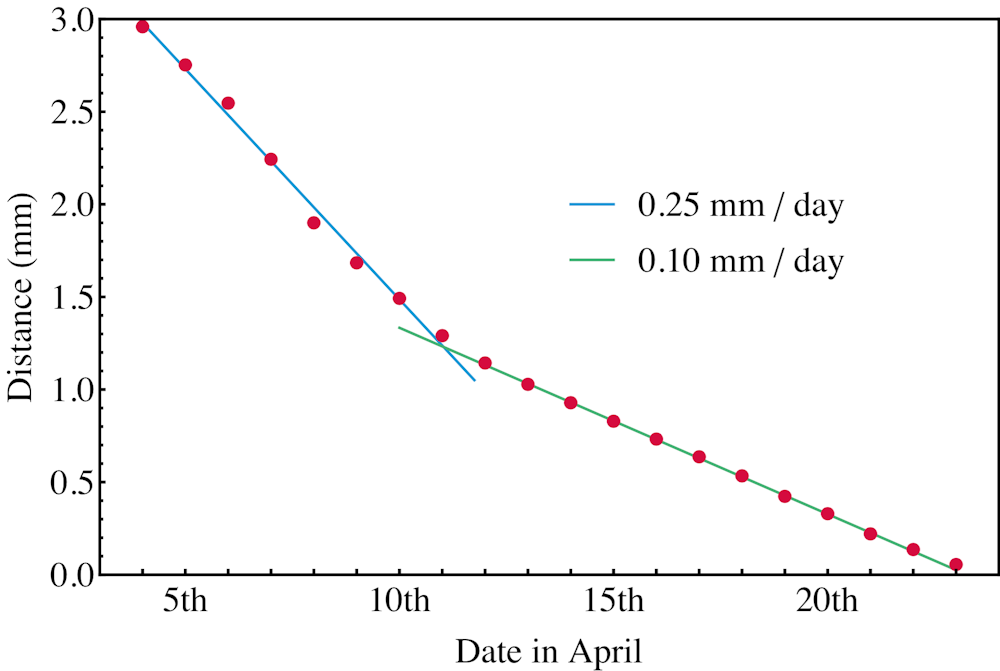
A discontinuity can be seen around the April 11/12 where the pitch changes from descending at a rate of 0.25mm a day (blue line) to 0.1mm a day (green line), indicating that touchdown occurred on April 11 or 12.
The exact moment can be further constrained as I was fortunate enough to closely examine the pitch drop at around midday of the 11th of April (after the photo from the 11th was taken) and a small gap – just a fraction of a millimetre – was still visible between the ninth and eighth drops.
Given the rate of descent indicated in the figure above it is concluded that touchdown occurred on April 12.
Although this clears up the issue of when the ninth drop touched down, more questions about the Pitch Drop Experiment have arisen.
After the eighth drop touched down without breaking, the second and third custodians – Professors Mainstone and White – had many conversations about what to do if the ninth drop also touched.
One thing they considered early on was lifting the glass funnel to provide more space for the drops to form – and then hopefully break away. But by the time they isolated this as a course of action it was too late as the eighth drop appeared to be cemented to the drop pile beneath it.
The pitch drop uncovered
Not wishing a recurrence with the ninth drop, on April 24 this year Professor White decided to replace the beaker – he took off the bell jar covering the pitch drop experiment for the first time in decades.
Unbeknown to him, or anyone alive, was that there was a seal between the glass bell jar and the wooden platform upon which the experiment sits, and that seal had degraded over time.
Instead of the bell jar lifting off as expected, the entire experimental setup briefly lifted up with the jar before separating and falling back down. This caused the ninth drop’s stem to separate completely from the funnel from which it was falling.
When viewing the broken stem something rather curious was observed. There was a depression in the centre of the stem indicating that the ninth drop wasn’t being supported by the entire circular cross-section of the cylindrical stem from above, but rather an outer ring as the stem at the point of breaking was hollow.
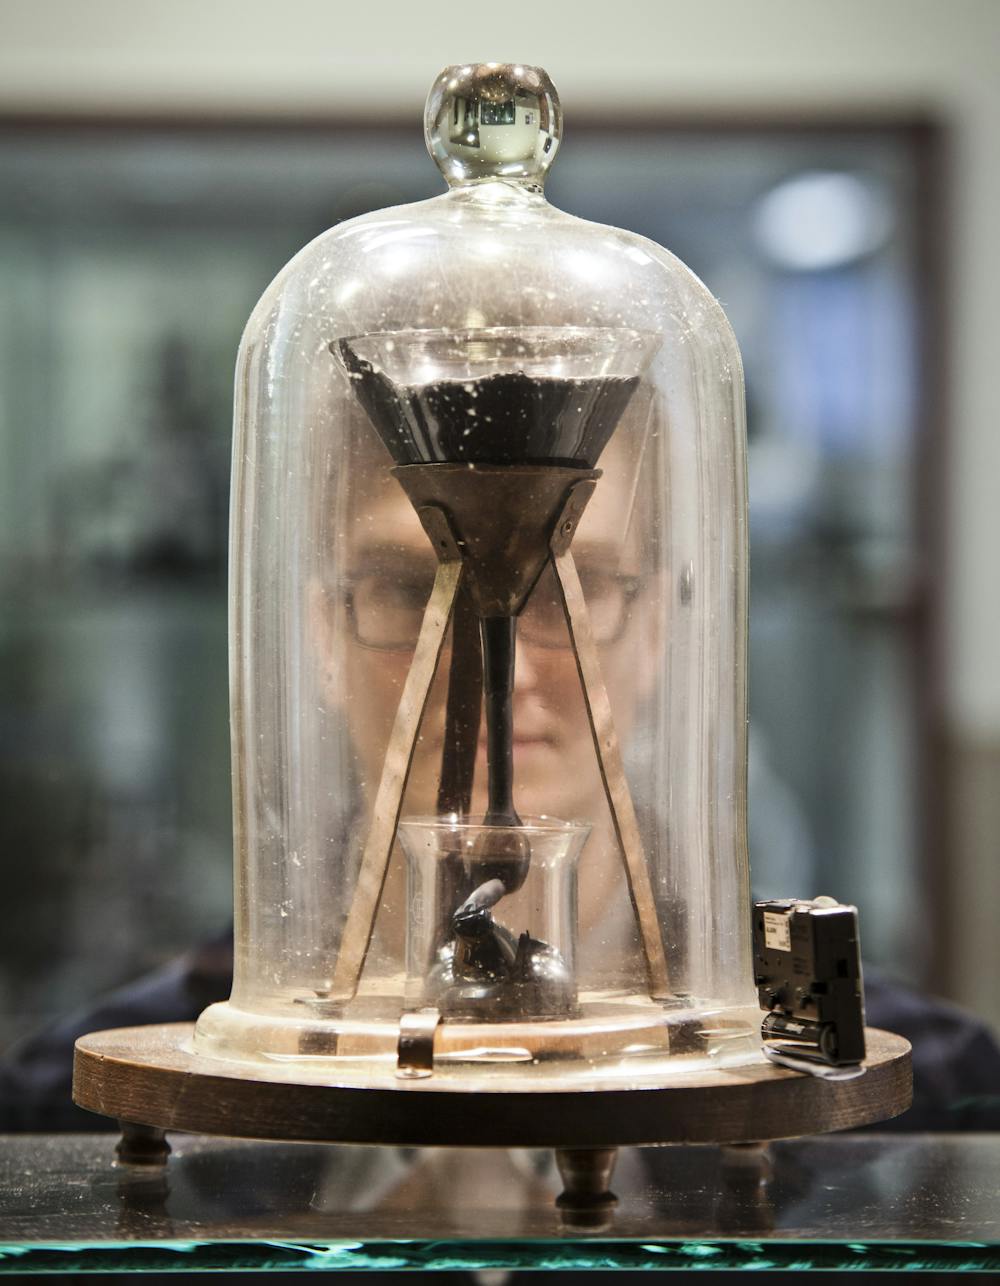
Things are speeding up
Another curious observation is that the tenth drop can be observed to be forming quicker than expected. Analysing the first six months of time-lapse footage reveals that the tenth drop’s volume is increasing at a rate of approximately 19 mm3 a day – that’s about one cubic centimetre every 50 days.
In 1984 the first, and only, paper published about the pitch drop experiment stated that the viscosity of the pitch (averaged over the first six drops) was 2.3×10⁸ Pa s (pascal seconds) – that’s about 250 billion times that of water.
Using the same dimensions as those in the paper I have calculated that the viscosity of the tenth drop is 2.7×10⁷ Pa s – about 30 billion times that of water.
Although this new value is an order of magnitude smaller than the old value – and would explain the apparent faster flow rate – it is within the range of values predicted by the original paper, using a model that included daily and seasonal temperature variations.
Another recent development for the pitch drop experiment, which could explain the increased flow rate of the tenth drop, is the lighting in the experiment’s display cabinet.
In April 2010 I arranged for fluorescent down-lights to be installed in the display cabinet. These were changed some years later to much hotter halogens.
As the pitch drop experiment has a fan base from all over the world who view it live over the internet it was necessary for the lights to be on continuously. But this increased the temperature in the display case and to make matters worse the pitch drop is sealed inside its very own greenhouse – the bell jar.
On October 17 this year, Professor White and I took several temperature measurements which revealed that the pitch drop experiment was above room temperature, by several degrees, and varied, with the pitch at the top of the funnel being almost ten degrees hotter than the pitch in the drop.
The increased temperature will have increased the flow rate, which could explain the tenth drop’s lower viscosity and speedy formation.
How much effect the raised temperature has had is hard to say, since temperature records have never been kept as the pitch drop experiment was started simply as a demonstration, but it is something we will find out.
The down-lights have now been changed to much cooler LED lights, which have brought the pitch drop experiment back down to room temperature.
Hopefully in another six months there will be enough data to make a comparison, but then again maybe the pitch drop may have other plans and it may take longer.
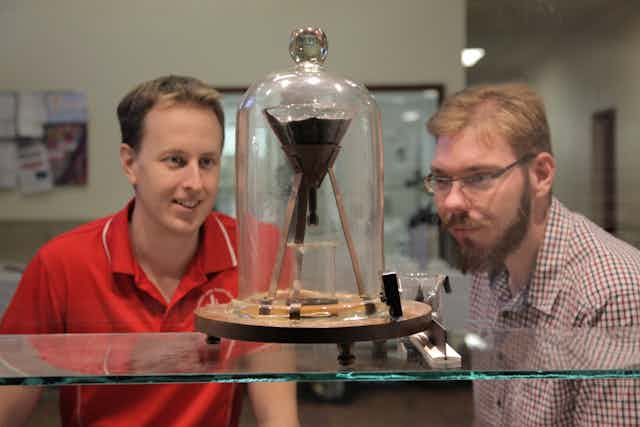
After all, there is no telling how many more custodians the pitch drop experiment will go through before it has finished revealing all its secrets. I guess we will just have to wait and see.
Keep an eye on the pitch drop experiment on the Tenth Watch website.