


Over the last year, the north grew faster than the south.
George Osborne, chancellor of the exchequer, in his Budget speech.
According to the chancellor’s Budget speech, Britain is the “comeback country” enjoying the spring of “a truly national recovery”. The theme is familiar, as several of his speeches on the potential of plans for a “northern powerhouse” have highlighted high rates of economic growth and job creation in the north of England. Osborne’s claim that the north grew faster last year is surprising, as it has been widely noted that the economic recovery since 2009 has been led by London and the south-east and that these regions have proved to be more resilient. So does the claim stand up to scrutiny?
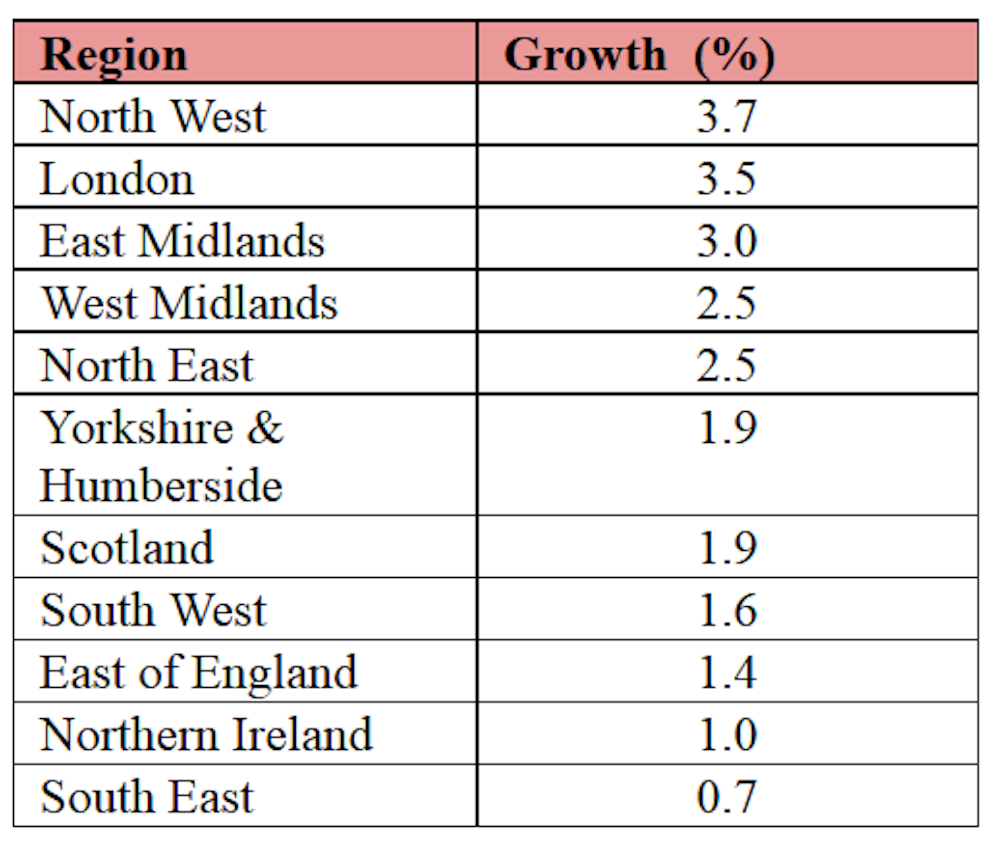
To test this we really need regional data on the value of output and employment for 2014. According to the Treasury, the key evidence behind the chancellor’s claim is data from the Office of National Statistics on economic output for the third quarter 2013, which is the latest available. Gross Value Added (GVA) measures the increase in the value of the economy due to the production of goods and services and here it is based on the income generated by resident individuals and firms, including inflation.

This provisional data does show higher rates of growth of GVA per head in northern regions, although London’s growth is high and these small differences would take a very long time to close the very large regional differences in GVA per head. So there is some justification for the claim based on this measure, although it is for 2013 and not last year, or 2014 as he says in his speech.
We can gain a better picture by putting this snapshot in a longer-term context. The chart below shows the change in GVA per head within each region since the pre-recession peak in 2007. We can see that the upswing in northern regions in 2013 is actually part of their recovery from a deeper downswing than in London and the south-east.
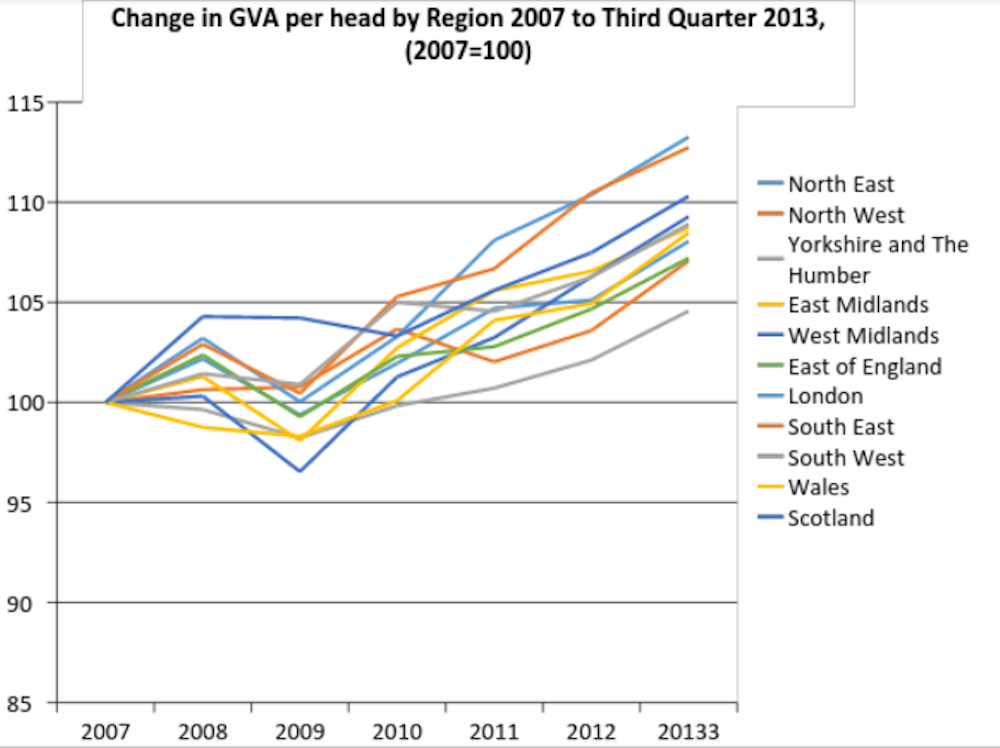
Consequently, the differences between regional GVA per head between 2007 and the third quarter of 2013 have widened slightly when compared to the national average. The lead of London and the south-east has increased slightly and the results for Wales are concerning. London has moved from 167.3% of the national average to 171.9% and the south-east from 108% to 110.5%. At the other end, the north-east has fallen from 86.1% to 85.2%, the north-west from 87.7% to 85.2% and Wales from 73.8% to 72.2%.
Do recent employment and jobs statistics provide more convincing support for the chancellor’s claim? The emphasis on growth in the north has apparently been based on employment from the Labour Force Survey. The most recent data shows the growth in employment over the year from November 2013 to January 2014 to November 2014 to January 2015.
With the exception of the north-west, the divergence between London and the rest of the country stands out. While some northern regions are finally enjoying a rapid period of recovery this is not true of other northern regions which are still struggling to exceed their pre-crash level. Given that the trends in total jobs vary from year to year, and that recovery is not simultaneous, broad claims based on one year are not persuasive.
Verdict
We are not yet able to judge whether the regions in the north of England grew faster in terms of the value of their output last year (2014) as we haven’t got the data. Results for earlier years suggest this may have been the case. Employment data for 2014 show a jobs recovery in some northern regions, but substantial variations within both the north and south and continuing strong growth in London. What is clear is that the recession has intensified a pattern of uneven regional growth.
Review
There are two senses in which the chancellor’s comment could be said to be misleading – this article discuss both of them. The first, which seems relatively less important, concerns the timing of the economic data on which the statement is based. As this article makes clear, although the latest available data is not for “last year”, it does show faster annual per-capita growth in northern regions.
The second sense in which these figures could be misleading is as an indicator of the relative long-term performance of different parts of the UK. As the article discusses, broad claims about long-term growth based on one year of data are not persuasive. In particular, because the northern regions saw a deeper and longer recession than London it is quite possible that some of those regions are now seeing faster growth as they finally recover. Longer-term data would suggest that large gaps in relative economic performance between north and south remain largely unchanged, or may even have been exacerbated by the recession.
Click here to request a check. Please include the statement you would like us to check, the date it was made, and a link if possible. You can also email factcheck@theconversation.com