


No wonder, when you have a participation rate that’s in free fall. Last month there was a fall by 0.2%, another 0.2%, it is now at 64.5%. What that indicates is that people have stopped looking for work. – Shadow minister for employment and workplace relations, Brendan O'Connor, doorstop interview, October 20, 2016.
When the Australian Bureau of Statistics (ABS) released the September Labour Force Survey data, shadow minister for employment and workplace relations Brendan O'Connor said the labour market participation rate was in “free fall” and that “people have stopped looking for work”.
Is that right?
Checking the source
The labour force participation rate is the number of people in the labour force (either employed or looking for work) expressed as a percentage of the civilian population aged 15 years and over.
When asked for a source to support his assertion, a spokesman for Brendan O'Connor told The Conversation:
You’ll see in the screen grab (figure 1), which is sourced from the ABS (Table 1, Participation rate – seasonally adjusted), that the participation rate did indeed fall from 64.9% in July 2016, to 64.7% in August 2016 and then to 64.5% in September.
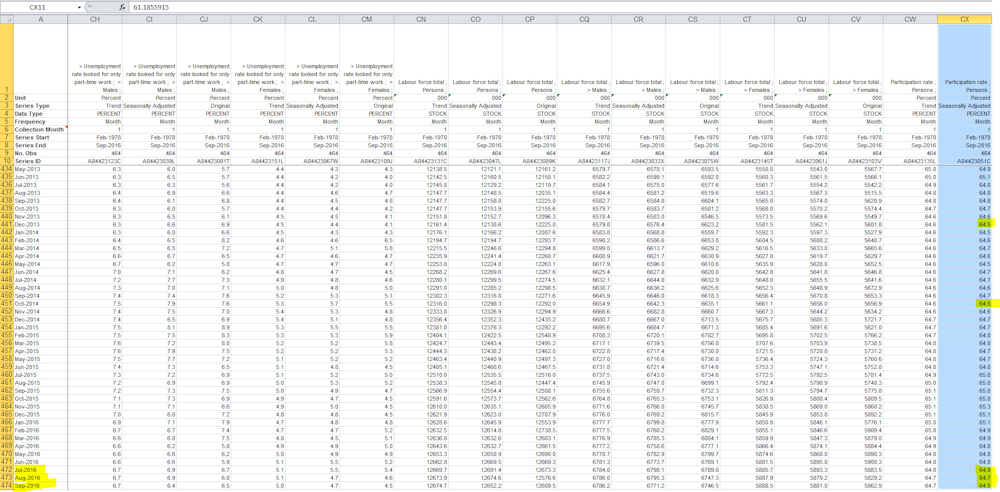
You can read the spokesman’s full response here.
Did the labour force participation rate fall by 0.2% (points) in the last two periods?
That depends on whether you’re using the trend data or the seasonally adjusted data. Trend estimates smooth out volatility in the seasonally adjusted estimates and are preferred by the ABS and many economists and statisticians.
O’Connor instead uses the monthly seasonally adjusted values. These figures do show a decrease by 0.2 points in each of the last two periods - July to August and August to September. But seasonally adjusted values are more volatile than trend estimates – as shown by the figure below.
Labour force participation rate – trend and seasonally adjusted, 2006-2016

According to the latest ABS trend data the labour force participation rate fell by less than 0.1 points, but remained unchanged compared to the previous period when rounding out the numbers.
So O'Connor correctly quoted the seasonally adjusted data - but a better indicator to use is trend data, which reveals the labour force participation rate remained broadly unchanged compared to the previous period.
Is the labour force participation rate in ‘free fall’?
The overall labour force participation rate has been decreasing since around 2010 but this is not necessarily a sign that the job market is tanking.
The labour force participation rate is influenced by two main factors:
- the behaviour of people and their willingness, ability or necessity to be in the labour force, and
- the composition of the civilian population.
We know two things that are having an impact here. The economy is not doing as well as it was during the mining boom, and Australia’s population is ageing.
Taking a longer term view, let’s look at the impact the ageing population is having on the overall labour force participation rate.
The overall labour force participation rate is made up of the participation rates of different working age groups.
Since the early 1980s the participation rate of the oldest group – people aged 55+ – has been increasing. But the youth labour participation rate has been dropping off as more young people stay on at school.
The participation rate of the prime working age groups (24-54 years) has been gradually increasing and converging.
Labour force participation rate – Age groups, 1981 - 2016

At the same time, the population has also been changing. Older age groups now take up a much larger share of the population than ever before. The 55+ age group now accounts for around one-third of the adult population, whereas 35 years ago it constituted one-quarter.
Population Composition – 1981 and 2016

Here’s where it gets slightly complicated.
We know the 55+ age group now makes up a much greater share of the labour force and overall population than before. And we know this group has a lower participation rate than other age groups - which is pulling down the overall rate.
But within that context, the 55+ age group’s labour participation rate is gradually rising. It is, in fact, entirely possible for the overall participation rate to fall even if the participation rate of all age groups were simultaneously rising.
The chart below shows that between 2010 and 2016, the labour force participation rate decreased by 0.4 of a percentage point. But most of the decline (67%) was due to demographic shifts in the Australian population.
Contribution of changes in labour force participation rate – behaviour and population drivers

The point here is that the labour force participation rate is not the useful tool it once was. It’s not as simple as Brendan O'Connor’s quote first suggests.
And it’s getting harder to use this metric to determine the strength of the economy and provide insights into labour supply and demand.
Have people ‘stopped looking for work’?
This is a tough one to answer. The data and indicators we currently use to assess this either aren’t good enough or as current as we need them to be.
The decrease in labour force participation rates between 2010 and 2016 were much more likely to be driven by the ageing population than people stopping looking for work. But this does play a small part.
And according to the latest ABS’ data on “discouraged workers” there are fewer people discouraged from looking for work than in the previous period.
Discouraged workers are classified as those who wanted to and were available to work, but were not actively looking for work. These people believed they would not be able to find a job for reasons such as being considered too old or young, or there not being any jobs in the local area.
The ABS collects information about discouraged workers annually. However, the latest available data is dated February 2015 - more than 18 months old.
These data show that there were around 106,000 discouraged workers. This represented a decrease in both absolute and relative terms compared to the previous year. Data for February 2016 is slated for release in November 2016.
Verdict
Brendan O'Connor’s assertions that the labour force participation rate is in “free fall” and that this indicates “people have stopped looking for work” were exaggerated.
While O'Connor accurately quoted the seasonally adjusted data, this volatile data set is not the most reliable indicator. A better indicator would be the trend data, which reveal the labour force participation rate remained broadly unchanged compared to the previous period.
In recent times, demographic changes have been the biggest influence in dragging the overall labour force participation rate down. The ageing population is skewing the labour force participation rate as an indicator of the health of the labour market.
A combination of indicators should be used to assess the strength of the labour market - more frequent data and a re-assessment of leading labour market indicators will help this along. – Rebecca Cassells
Review
This is a sound FactCheck and points out how a simple number, such as the participation rate, is the result of complex factors. Simplifying it down to a phrase like “people have stopped looking for work” is misleading.
Labour market statistics, including the participation rate, are only estimates, not the actual numbers in the population. They are based on the Labour Force Survey, which is a sample of about 0.33% of the civilian population aged 15 years and over. Because they are based on a sample of the population, the statistics have errors.
Brendan O’Connor’s comments regarding the recent estimates of the participation rate referred to a rate of 64.5% - a fall of 0.2 percentage points from 64.7% in the previous month (with consequent alarm about people giving up looking for work).
However, the ABS report on the Labour Force Survey clearly says that the estimate of the monthly change in the participation rate rate has a “95% confidence interval” of -0.6 to +0.2. In other words, we can be 95% certain that the participation rate was somewhere between 64.1% (a dramatic drop) and 64.9% (a strong increase).
The FactCheck author points out clearly the dangers of basing conclusions about the labour market on month-to-month variations. – Phil Lewis