
The table below shows the final Senate results, as announced by the Australian Electoral Commission (AEC) for each state and territory. The results in WA could change because only 14 votes decided a critical exclusion, which is why I have put an asterisk beside WA in the table. The “Change” row in the table represents changes in party representation from the current Senate. As Labor’s Senate vote was over 10% higher in 2007, when these seats were last contested, they bore the brunt of the losses.
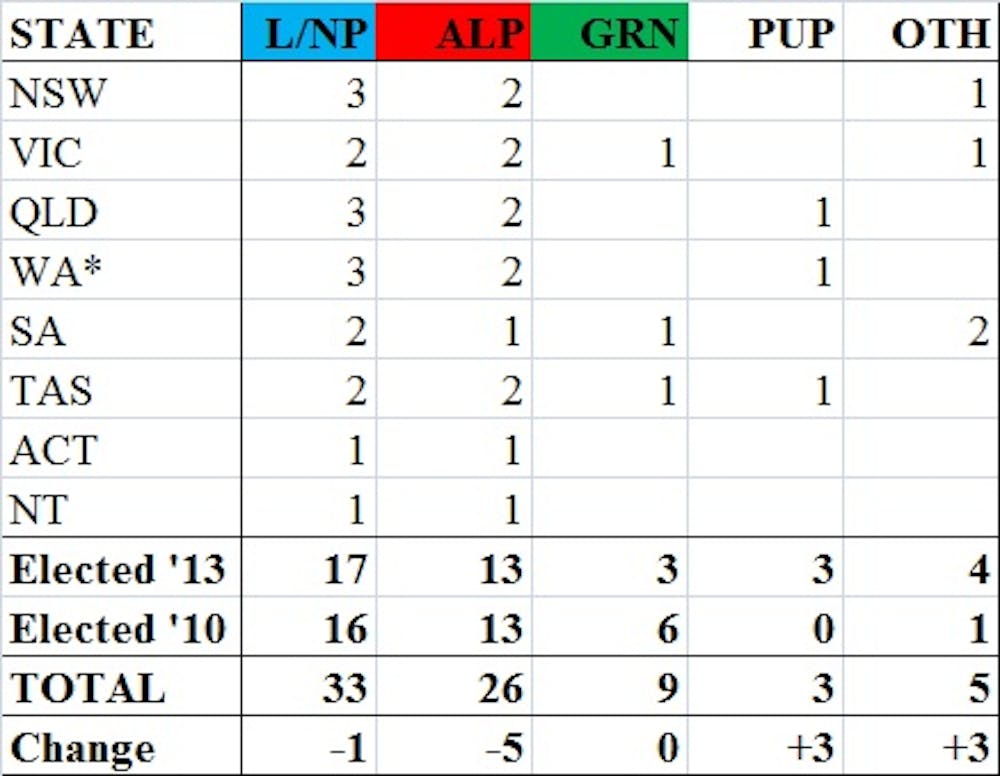
State Senators have six year terms, and the Senators elected in 2013 will begin their terms on 1 July 2014. Territory Senators have their terms linked to the term of the House of Representatives. As a result, the Senate from July 2014 will reflect the results of all state and territory Senate elections in 2013, but only the state Senate elections from 2010. There is a total of 76 Senators, and tied votes are lost, so the Coalition will need 39 votes to pass its legislation. If Labor and the Greens oppose the Coalition, they will need six of the eight cross-benchers to support them.
Other than the three Palmer United Party (PUP) Senators, the five cross-benchers represent the DLP, Family First, the Liberal Democrats, the Motoring Enthusiast Party, and Independent Nick Xenophon. The first three of these Others are definitely right-leaning, and combined with PUP would give the Coalition the 39 votes it needs to pass legislation opposed by the left.
Nationally, Labor won 30.1% of the overall Senate vote, down 5.0% on 2010. The Greens received 8.6%, down 4.5%. As a result, the total Labor/Green vote was only 38.7%, down a huge 9.5%. This is well short of the 42.9% required for three seats in a state, which explains why Labor and the Greens did not win three combined seats in any state except Victoria and Tasmania. Despite the fall in the Labor/Green vote, the Coalition vote was also down 0.9% to 37.7%. The major beneficiaries were the PUP, which debuted with 4.9% of the Senate vote and three seats, and the Liberal Democrats, which won 3.9%, up 2.1%. Particularly in NSW, the Lib Dem vote increased due to confusion with the Liberals.
Notes on State Counts
In NSW, the Liberal Democrats benefited greatly from being placed at the far left of the Senate ballot paper, winning 9.5% of the vote. Had the Labor and Green vote been stronger in NSW, this would have cost Liberal Arthur Sinodinos his seat. As it was, he won his seat comfortably on small right-wing party preferences.
In Victoria, the Motoring Enthusiast Party’s Ricky Muir was able to win through a preference snowball on just 0.5% of the vote, defeating Liberal Helen Kroger for the final seat. This result clearly illustrates the need for Senate reform.
The Queensland result made sense from a democratic perspective, with PUP winning 9.9% of the Queensland Senate vote.
In WA, a critical count between the Christians and the Shooters decided the final two seats. Had the Shooters been excluded, the Sports party and the Greens would have won, instead of PUP and Labor. As it was, the Christians were excluded by just 14 votes. Had the Sports party won, they would have done so with just 0.2% of the vote. Antony Green has more details on the WA count. Both the Greens and Sports party have requested a recount. The request was denied, but both parties are appealing to the Australian Electoral Commissioner, who has not yet made a decision. This contest could end up in the Court of Disputed Returns.
In SA, Labor and the Greens BOTH preferenced Family First’s Bob Day ahead of Stirling Griff, the No. 2 on Nick Xenophon’s ticket. Xenophon’s group won 1.74 quotas, but received little help from preferences, and so Bob Day was elected instead of Griff. Had Labor and the Greens put Griff ahead of Day, Griff would have won a seat, with the final seat contested between the Liberals and Day. As Kevin Bonham writes, Labor and the Greens should not complain about Day, because he’s their Senator.
In Tasmania, the Sex Party should have won the final seat according to the ABC calculator. However, the calculator assumes that all votes are above the line ticket votes, but 10% of Tasmanians voted below the line. As a result, preference flows to the Sex Party were not as strong as the ABC calculator predicted, and so the Sex Party was actually 244 votes behind Labor at a critical exclusion. PUP did very well from below the line votes, and won at another critical point by over 1200 votes when the calculator method would have had them behind by over 1400 votes.
The territories both went one Labor, one Coalition as expected, though Labor had to go to preferences in the NT, and the Liberals also went to preferences in the ACT.
House of Representatives
There are 11 seats where one of the final two candidates was not from the Coalition or Labor. The AEC has not yet started a two party count in those seats. Four of these seats are progressive seats, and the other seven are conservative seats, so the overall movement in two party terms will be to the Coalition, increasing its current 53.4% of the two party vote, probably by around 0.2-0.3%.
Almost all seats except Fairfax are final. Wills has been declared, but a two candidate count is yet to be conducted in this safe Labor seat. In Fairfax, a recount is in progress between Clive Palmer and the Liberals, and Palmer currently leads by just seven votes. Thus the result for the House will be: Coalition 90, Labor 55, Others 4 and one seat a Palmer vs Liberals contest. When the two party count is complete, I will present a full report on the House.