

Debate over whether or not public sector pay should be capped at 1% is raging in the UK. First Theresa May, the prime minister, indicated she might ditch the cap that has been in place since 2010. She quickly backtracked on the idea but remains dogged by pressure from her backbench MPs to rethink the austerity policies that they feel led to the poor election result.
Meanwhile high-profile cabinet ministers, including Boris Johnson and Michael Gove, have said they think the cap should be lifted. Clearly politics is at play.
From an economic standpoint there is the issue of how sustainable a long-term cap of 1% (below inflation) is on pay settlements. Pay restraint is a reason why the government struggles to recruit and retain high-quality staff to deliver health services, education and other public services.
We recently wrote a report for the Office of Manpower Economics, the body supporting the government’s independent Pay Review Bodies (PRBs) which advise on the pay of 2.5m public sector workers (about half of all public sector workers), detailing some of the recent trends. There are four key findings:
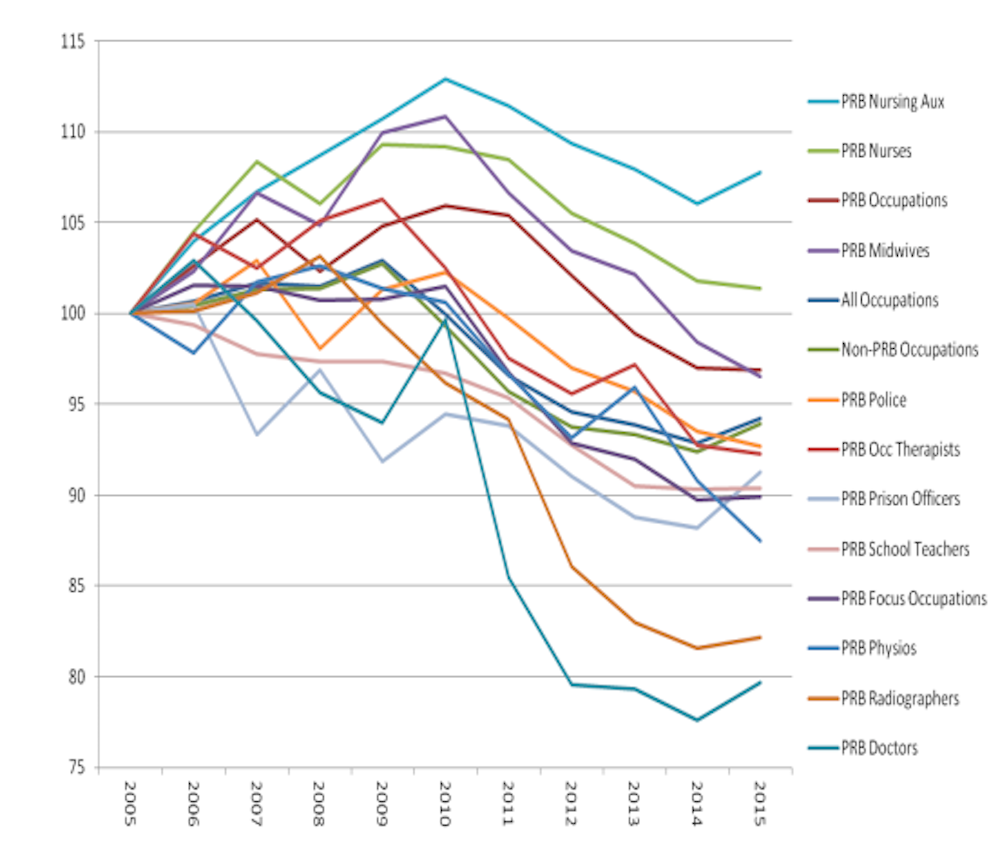
- At the occupational level, average hourly earnings have fallen by 5.8% since 2005 (taking inflation into account – real gross earnings).
- The decline was steeper among occupations whose pay is not set by PRBs (6.1%) than it was among PRB occupations (3.1%).
- Changes in average earnings varied considerably between PRB occupations, even among those whose pay was set by the same PRB.
- Eight of the ten largest PRB occupations experienced a drop in real median earnings.
Of course, average earnings within a particular occupation may vary from year to year with changes in the composition of workforce. But even after we account for those changes, we still find substantial differences in the fortunes of PRB occupations. The findings challenge the popular misconception among commentators and politicians that a 1% cap on pay settlements has a uniform impact on the various jobs it affects.
In fact, changes in actual earnings rarely resemble changes in pay settlements because they reflect not only changes in base pay, but also changes in things like level of overtime pay, different types of shifts, promotion rates and numerous other ways that pay is determined. This leads to gaps between pay settlements, on the one hand, and actual earnings on the other – what economists refer to as “wage drift”. That is why it is important to look at what has happened to actual earnings in an occupation over time.
Breaking down the data
To evaluate whether these changes in average PRB earnings are big or small we compared them with similar non-PRB occupations. Some are public sector jobs such as firefighters, whose pay is not governed by PRBs. In our analyses firefighters are the closest non-PRB occupation to police officers and prison officers. Their pay is set via collective bargaining. They were were recently offered a 2% pay increase – stirring up the public sector debate even further.
When comparing PRB earnings growth to that among their nearest non-PRB comparator occupations we found that earnings growth was higher for the PRB group in five cases and lower in five cases. But differences were only statistically significant in three: PRB nurses and PRB nursing auxiliaries experienced higher earnings growth than their non-PRB comparison occupations; and PRB radiographers experienced significantly lower growth than their non-PRB equivalent.
When we account for differences in the composition of the workforce for each occupation between 2005-2015 – factors such as age and experience as people leave and enter – we found that earnings growth was higher for the PRB group in seven cases and lower in three cases.
Concern over public servants’ pay is compounded by the low pay many of them receive. It is well established in economics that perceptions of wage differences underpin attitudes to wage inequality. Most people don’t compare themselves to celebrities or billionaires such as Bill Gates and Warren Buffett. Our sense of whether or not we are well-off comes from comparing ourselves to our peers.
Of our ten PRB occupations, five were outside the top 100 occupations in terms of median hourly earnings over the whole period. In 2015, nursing auxiliaries were the lowest paid of our ten PRB occupations with median earnings of £10 per hour, putting them in 276th position in the occupational earnings rankings among the 394 occupations in our study. Five of the ten PRB occupations had fallen in the occupational earnings rankings since 2005 with radiographers and physios dropping furthest (30 and 20 places respectively).
Taken together, a picture emerges of earnings stagnation or decline for most occupations – PRB and non-PRB – since 2005. The big difference between PRB employees and those in non-PRB occupations in the private sector is that PRB employees are public servants. As such, the government can determine their annual pay settlement.
When deciding what to do government will weigh public concern over pay equity for groups like nurses, and experts’ concerns regarding public employers’ ability to recruit, retain and motivate staff, against the potential costs of lifting the 1% cap for the public purse. That cost could be quite considerable. Periods of public sector pay restraint are often followed by a period of wage inflation, but weak wage growth since the recession suggests this is unlikely to happen on this occasion.