

Physicians and public health experts know that older adults are more susceptible to the flu than those in other age groups. We also know the health of Black Americans is worse than that of almost all other groups for not only flu, but for chronic conditions and cancer. These are two examples of health disparities, or health gaps – when demographic groups show differences in disease severity.
As we analyze the latest data from the COVID-19 pandemic, a more complete picture on infections, hospitalizations and death rates has emerged, along with new conversations about health disparities. The COVID data underscore what social scientists, epidemiologists and other public health researchers have long said: It is not enough to look at a lump sum of data about any health issue, including COVID-19, and think we have the full picture.
By disaggregating the data – that is, breaking the data down into subgroups, like age and race – we can learn how to make the most of our limited resources. Do that, and we can better strive for a more equitable society and increased entry to a healthy lifestyle for all Americans.
As a practitioner and scholar at Mississippi State University (sometimes we call ourselves pracademics), I am driven by compassion and science. Now, with the recent advent of faster and faster access to more and more data, collecting and analyzing disaggregated information – data about gender, ethnicity, disability and neighborhoods, along with age and race – has become one of the biggest components of public health practice.
Musings from Mississippi
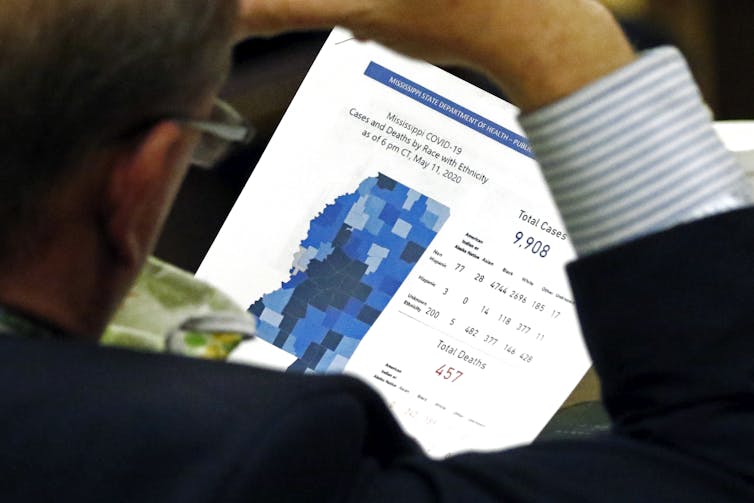
Early in the pandemic, as the virus reached Mississippi, its state Department of Health began reporting numbers each day. To be able to assess case and mortality rates, I linked data with the census reports of Mississippi’s population.
I quickly found this: The percentage of African Americans who got COVID-19 was higher than that for whites; the percentage of African Americans who died from it was also higher than that for whites. But among all people, whites were more likely to die from COVID-19 if they got it.
I was curious the rates would change direction between races. Because I was examining total population data – not data disaggregated by setting – I thought there might be something about a particular setting or subpopulation that was driving that odd finding. Maybe it was a specific part of the state or a certain sector of the workforce? Maybe it had something to do with long-term care facilities? That last question would be an important one.
After breaking down the data across settings, and looking at just the rates for people living in the community versus those living in a long-term care or nursing home facility, it all began to make sense. I found the unusual change in the data’s direction resulted from the long-term care population’s being overwhelmed with cases. In Mississippi, our long-term care residents are more likely to be white. The relationship between race and COVID-19 mortality is different between the community and long-term care facilities.
Why this matters
From a statistical perspective, disaggregation is important. It gives us the backing we need to demonstrate the complexity of the relationship between factors like race and COVID-19 infection and mortality rates.
The case in Mississippi tells us that if we don’t disaggregate the data, we would have an incorrect picture of what’s happening with COVID-19. We would have probably patted ourselves on the back for not having such bad racial disparities after all. But a deeper dive into the data shows that racial disparities persist. And when we look at long-term care facilities, we find problems of a different sort.
[Deep knowledge, daily. Sign up for The Conversation’s newsletter.]
My experience in exploring COVID-19 cases is specific to Mississippi. We need to replicate this nationally, and with other subpopulations, including K-12, college and university settings, residential care facilities and prisons. We must also bring representatives from these populations to the table and engage them in the decision-making process. Furthermore, the data should drive our advocacy for resources at the local, state and federal levels. More than ever before, we must rely on science to guide us in responding to COVID-19 and future public health crises.
As society eventually recuperates from COVID-19, we must not lose sight of the lessons it has taught us. Our data must be granular enough so we can know how each subpopulation is handling not just COVID-19, but chronic disease, cancer, injuries and gun violence. Then, and only then, can we improve our decision-making on health issues and make sure access to public health services and clinical care is available for everyone.