


The COVID-19 pandemic brought the term vaccine efficacy into the public eye. But what do the efficacy numbers mean?
For example, at first glance, a vaccine efficacy of 70 per cent might suggest that in 30 per cent of cases, people are not protected by the vaccine and could get sick. But this cannot be, as clearly 30 per cent of people who get vaccinated do not become sick. The percentage seems to sow confusion.

As professors of statistics who explain technical concepts to non-specialists, we propose to shed light on these numbers. The concept is related to randomized controlled trials (RCT), like the Moderna, Pfizer-BioNTech or Astra Zeneca Phase 3 vaccine trials.
Typically, a RCT follows two large groups, called cohorts, that are similar in relevant ways (in age distribution and ethnicity, for instance). One cohort is injected with the new vaccine, the other one a placebo with no impact on immunity.
Participants are randomly assigned to receiving vaccine or placebo (that’s why it’s called a randomized trial), but not all on the same calendar day. At determined times after the first inoculation a second dose is administered. During the follow-up, people who tested positive for the condition, as well as those who required hospitalization or died from the condition, are counted and compared between cohorts.
Vaccine efficacy: a relative measure
For getting to the gist of vaccine efficacy, we use simple hypothetical values. This makes calculations straightforward while remaining close to what is observed in trials.
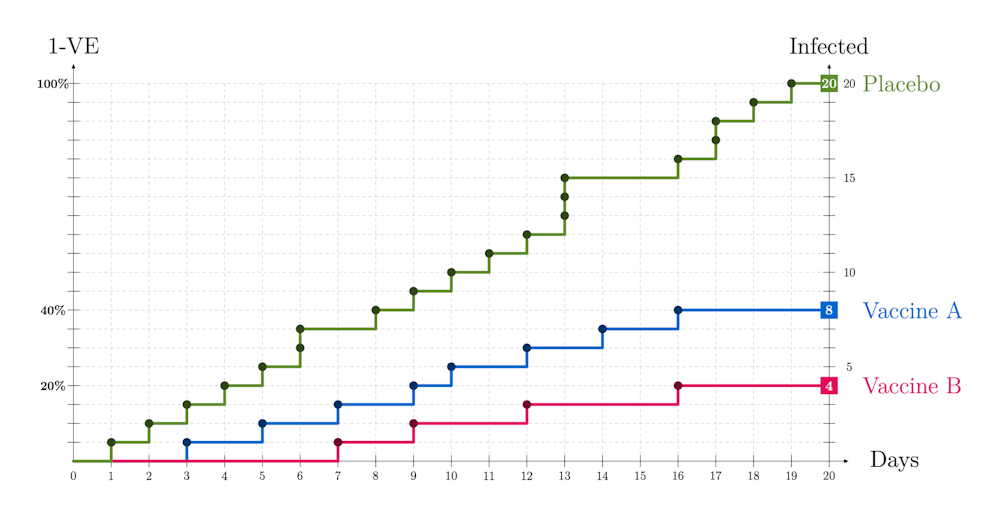
Imagine two studies for two vaccines, vaccine A and vaccine B and, in each study, two cohorts — vaccinated and unvaccinated — with 10,000 participants each. Twenty days after injecting the vaccine we count those who tested positive for the disease and report vaccine efficacies (VE): VE(A) = 60 per cent for vaccine A and VE(B) = 80 per cent for vaccine B. How were these values calculated? What do they mean? The clue is in comparing vaccinated with unvaccinated.
To illustrate, assume that during the time of the study in the general population there is an incidence of one infected case among 10,000 people per day. So, in a cohort of 10,000 unvaccinated we have on average one infection a day and, after 20 days, we end up with 20 infected among the unvaccinated. What about the vaccinated?
Suppose we find eight infected in Study A and four infected in Study B. By comparing with the placebo cohorts where there are 20 infected, we can see that the vaccine has reduced the number of infected people by 12 in Study A and by 16 in Study B.
This protective effect is the vaccine efficacy computed as follows:
Study A: VE(A) = (20-8)/20 = 12/20 = 0.6 = 60 per cent
Study B: VE(B) = (20-4)/20 = 16/20 = 0.8 = 80 per cent
The formula above illustrates the fact that VE quantifies the reduction in risk of getting infected where one compares a vaccinated with an unvaccinated person and not the risk itself.
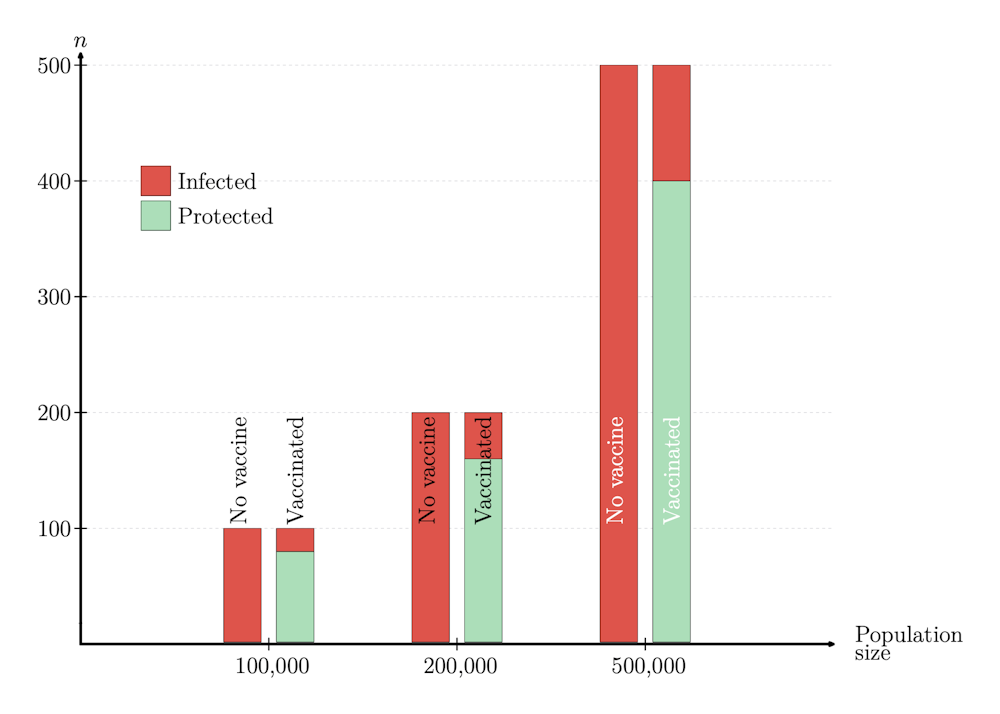
In our numerical example the risk of infection with no vaccine is one in 10,000 per day. If VE = 80 per cent, this risk is reduced by 80 per cent: infections in vaccinated are one-fifth (or 100-80=20 per cent) of infections in unvaccinated. Thus the risk of infection in vaccinated is one in 50,000 per day.
What if VE = 0 per cent? Vaccinated have the same risk as unvaccinated! And if VE = 100 per cent? There are no infected among vaccinated.
In conclusion, VE is neither a cohort percentage, nor a population percentage; VE is the percentage of potential infected who are protected by the vaccine.
Timing also plays a key role.
Can we compare vaccination strategies?
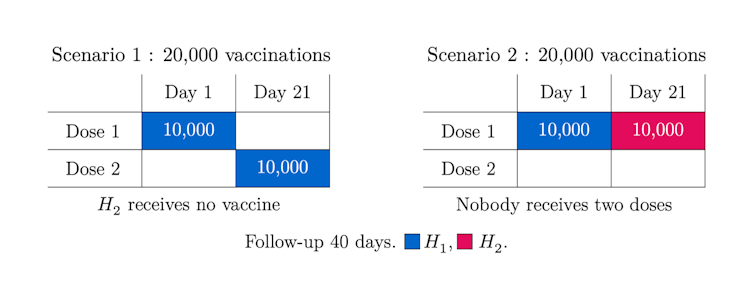
Another issue that has come up in the news is vaccination policies. We propose to compare two vaccination strategies, postponing or not the distribution of a second dose of a vaccine in a 40-day time window. We suppose:
unvaccinated infection rate: one in 10,000;
VE1 = 60 per cent: efficacy after the first dose;
VE2 = 80 per cent: efficacy after the second dose;
We administrate the vaccine to a group of 20,000 divided in two halves, H1 and H2.
The COVID-19 vaccines have no immediate immunization effect because it takes approximately 14 days for a noticeable outcome, but for illustration we assume there is no immunization lag. In Scenario 1 we vaccinate H1 only, at day one with dose one and at day 21 with dose two; in Scenario 2 we vaccinate both H1 and H2 but with one dose only.
What scenario is the winner? Which one ends up with fewer infected after 40 days? The answer is illustrated in the graphs below:
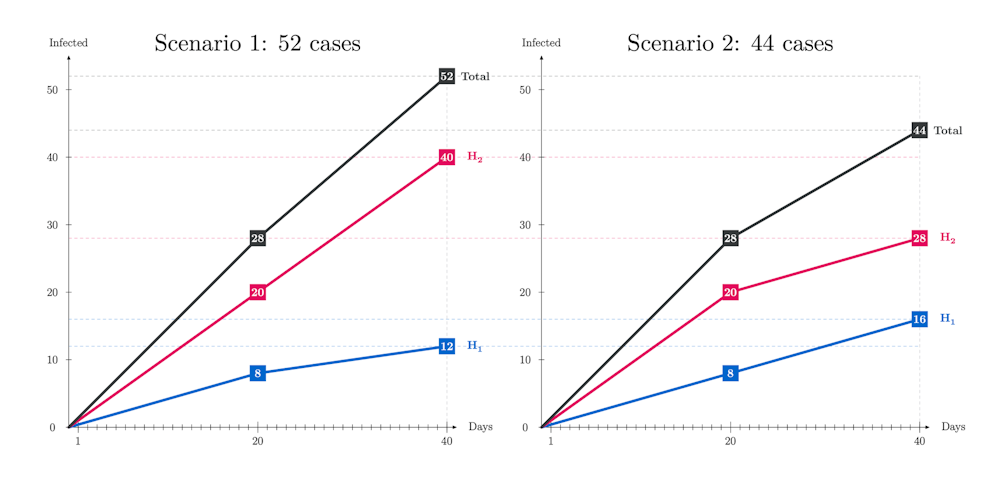
There are 18 per cent more cases in Scenario 1 but why? In this scenario, even if the people in H1 get fully vaccinated with two doses, those in H2 keep getting infected at the non-reduced rate as they receive no vaccine. So, this simplified example suggests that to postpone the second dose and continue vaccinating with dose one for a while could be advantageous.
This being said, in practice more considerations are at stake, like severity and mortality or administration constraints. Indeed, if people in H1 are more prone to severe forms of the disease, during the last 20 days the number of such serious cases double in Scenario 2 as compared with Scenario 1. Thus, there is no clear winner, since in Scenario 2 there may be more serious cases, while in Scenario 1 there are more infected. These numerical illustrations point to the challenge of finding best vaccination strategies.
Cases per day: Many or few?
Why bother with an incidence of one case in 10,000 per day? It sounds low. Well, it is high by the standards of the U.S. Centers for Disease Control. Just check: in a population like Canada’s of 38 million, it comes to 26,600 new cases per week — 10 times higher than what Canada experienced at the beginning of July 2021. Last summer, in 2020, in placebo cohorts of RCT vaccine studies the incidence was almost two or roughly four in 10,000 per day.
Finally: What about 50% vaccine efficacy?
In June 2020, the FDA placed the threshold for acceptable vaccine efficacy at VE = 50 per cent or higher. This goal was greatly surpassed, with reports of VE = 95 per cent or VE = 94.1 per cent after two doses.
Still, even a vaccine 50 per cent effective is very worthy: it can cut the risk of infections or hospitalizations in half. Actually, the same vaccine could present different efficacies, depending on the event: for severe cases and hospitalizations, Astra Zeneca reported 100 per cent efficacy.
There are more complex analyses in ongoing field studies that involve the related concept of vaccine effectiveness. We touch upon these issues in a recent manuscript not yet published, but this is another chapter in the vaccine story.
Do you have a question about COVID-19 vaccines? Email us at ca-vaccination@theconversation.com and vaccine experts will answer questions in upcoming articles.