
The “yes” vote on same-sex marriage carried the day in every state in Australia, but the “no” vote was strongest in New South Wales – particularly around western Sydney.
The results suggest that, as predicted, social conservatism among many ethnic communities loomed large as a factor.
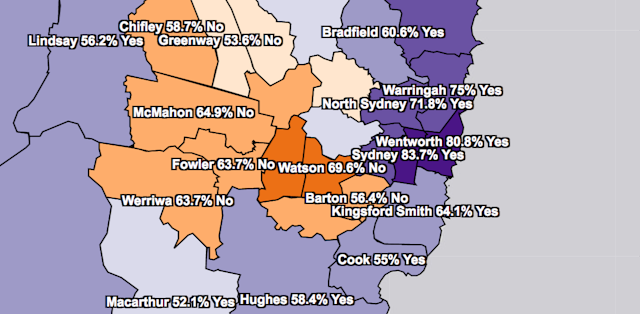
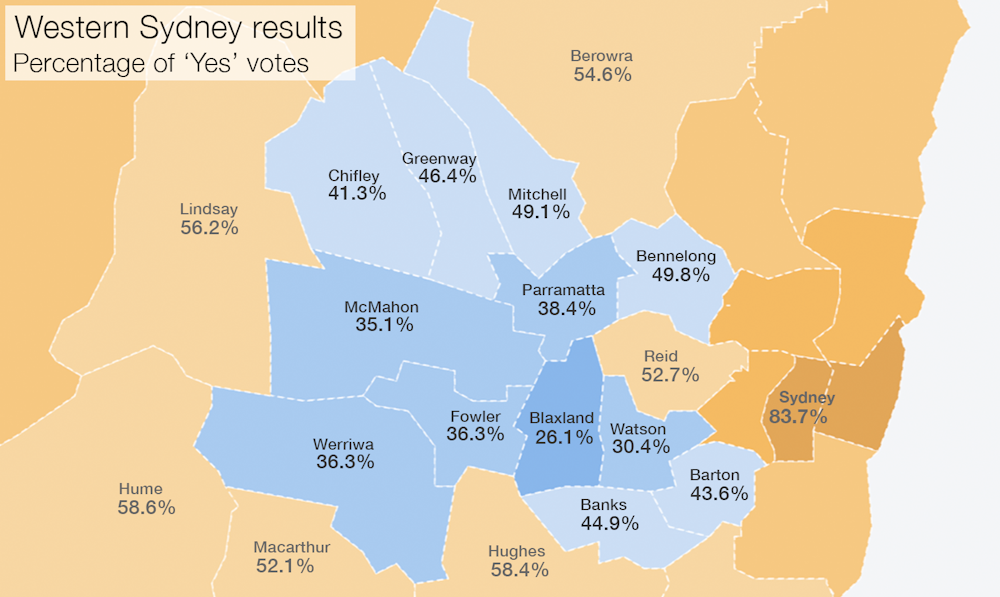
In NSW, the “yes” vote came in at 57.8% and the “no” at 42.2%, with a participation rate of 79.5% – but in some western Sydney electorates the “yes” vote was as low as 26.1%.
Read more: Same-sex marriage survey by the stats: a resounding 'yes' but western Sydney leads 'no' vote
In the seat of Blaxland, held by Labor’s Jason Clare, 73.9% of respondents said “no” to making same-sex marriage legal in Australia. This electorate takes in suburbs such as Berala, Regents Park, Sefton, and Villawood, as well as parts of Auburn, Bankstown, Lidcombe, Merrylands, South Granville, Villawood, and Yennora.
The seat of Watson, held by Labor’s Tony Burke, was also a firm “no”: 69.6% of respondents said they did not support same-sex marriage, while just 30.4% did. This seat takes in Burwood Heights, Greenacre, Lakemba Punchbowl, Roselands, Strathfield South, as well as parts of Bankstown, Belmore, Beverly Hills, Burwood, Campsie and Canterbury.
What’s driving this?
The opposition to same-sex marriage – and to the related issues that the “no” campaign raised such as the Safe Schools Coalition – was particularly resonant in communities where people have fairly poor educational backgrounds, somewhat limited English language skills and their information is mediated primarily through religious institutions.
So, in localities where there are strong communities built around Eastern Orthodoxy, Islam, Eastern Catholicism, African Christianities, Asian Christianities (ranging from Catholic to Evangelical), and even in other areas with pockets of Orthodox Judaism, there were singular funnels of information presented in cultural and moral terms.
There’s little information available to those people from any other source that they would trust, or to which they have easy access.
These are electorates with high proportions of people born overseas. But being overseas-born is not, in itself, an indicator. Electorates such as the seats of Sydney and Melbourne also had a high “yes” vote and high proportions of overseas-born people.
Read more: What the numbers say (and don't say) in the same-sex marriage survey
The electorates in western Sydney where the “no” vote was strongest have high rates of unemployment. For instance, Blaxland, which has more than 50% of its population born overseas, has a 10.2% unemployment rate (compared to a national unemployment rate of 5.6%).
The “no” vote was also strong in places where there is a high concentration of people from Chinese backgrounds. This was true even in electorates where there’s a higher socioeconomic profile, but significant numbers of people from China and Korea, such as the seats of Bennelong (where the “yes” vote came in at 49.8% and the “no” vote was 50.2%) and Banks (where the “yes” vote was 44.9% and the “no” vote garnered 55.1%).
In short, the electorates most likely to vote in favour of same-sex marriage have many highly educated non-believers, while the electorates most likely to vote against it would be more working-class, non-European overseas-born, religious communities.
It’s complicated
It is important not to allow stereotypes to overwhelm analysis: within many ethnic faith communities, groups of often very courageous marriage equality activists have been bringing their message to families and networks.
Moreover, there are many currents of political and social views within communities. The 2011 and 2015 NSW state elections revealed much about the reorientation of western Sydney’s communities, especially those associated with Islam.
There are more than 60 nationalities in a variety of sects among followers of Islam in western Sydney, besides dozens of other religions and ethno-national backgrounds.
The strong coalitions that have emerged across groups over local political issues, and social media strategies of organisation among all ethnic communities, suggests a legacy from this campaign that will continue. The consequences are unpredictable.
My own research has tracked these developments for nearly 40 years. The evolution of a new multicultural politics from the interactions between newcomers and older political forms has been well documented.
This is not simply about religion; it’s about culture in a more complex sense. The electorate of Grayndler (where nearly 80% of respondents voted “yes”) takes in areas like Marrickville and Dulwich Hill and has a culture that is broadly cosmopolitan. Yet it borders with Watson (where the “yes” vote was as low as 30%), an electorate that can be thought of as almost a cluster of traditional villages.
So, too, in other communities we see deep differences between the older generations and their Australian-educated children.
Interestingly, most of the local MPs in these “no”-voting western Sydney seats are Labor MPs who are publicly supporting same-sex marriage.
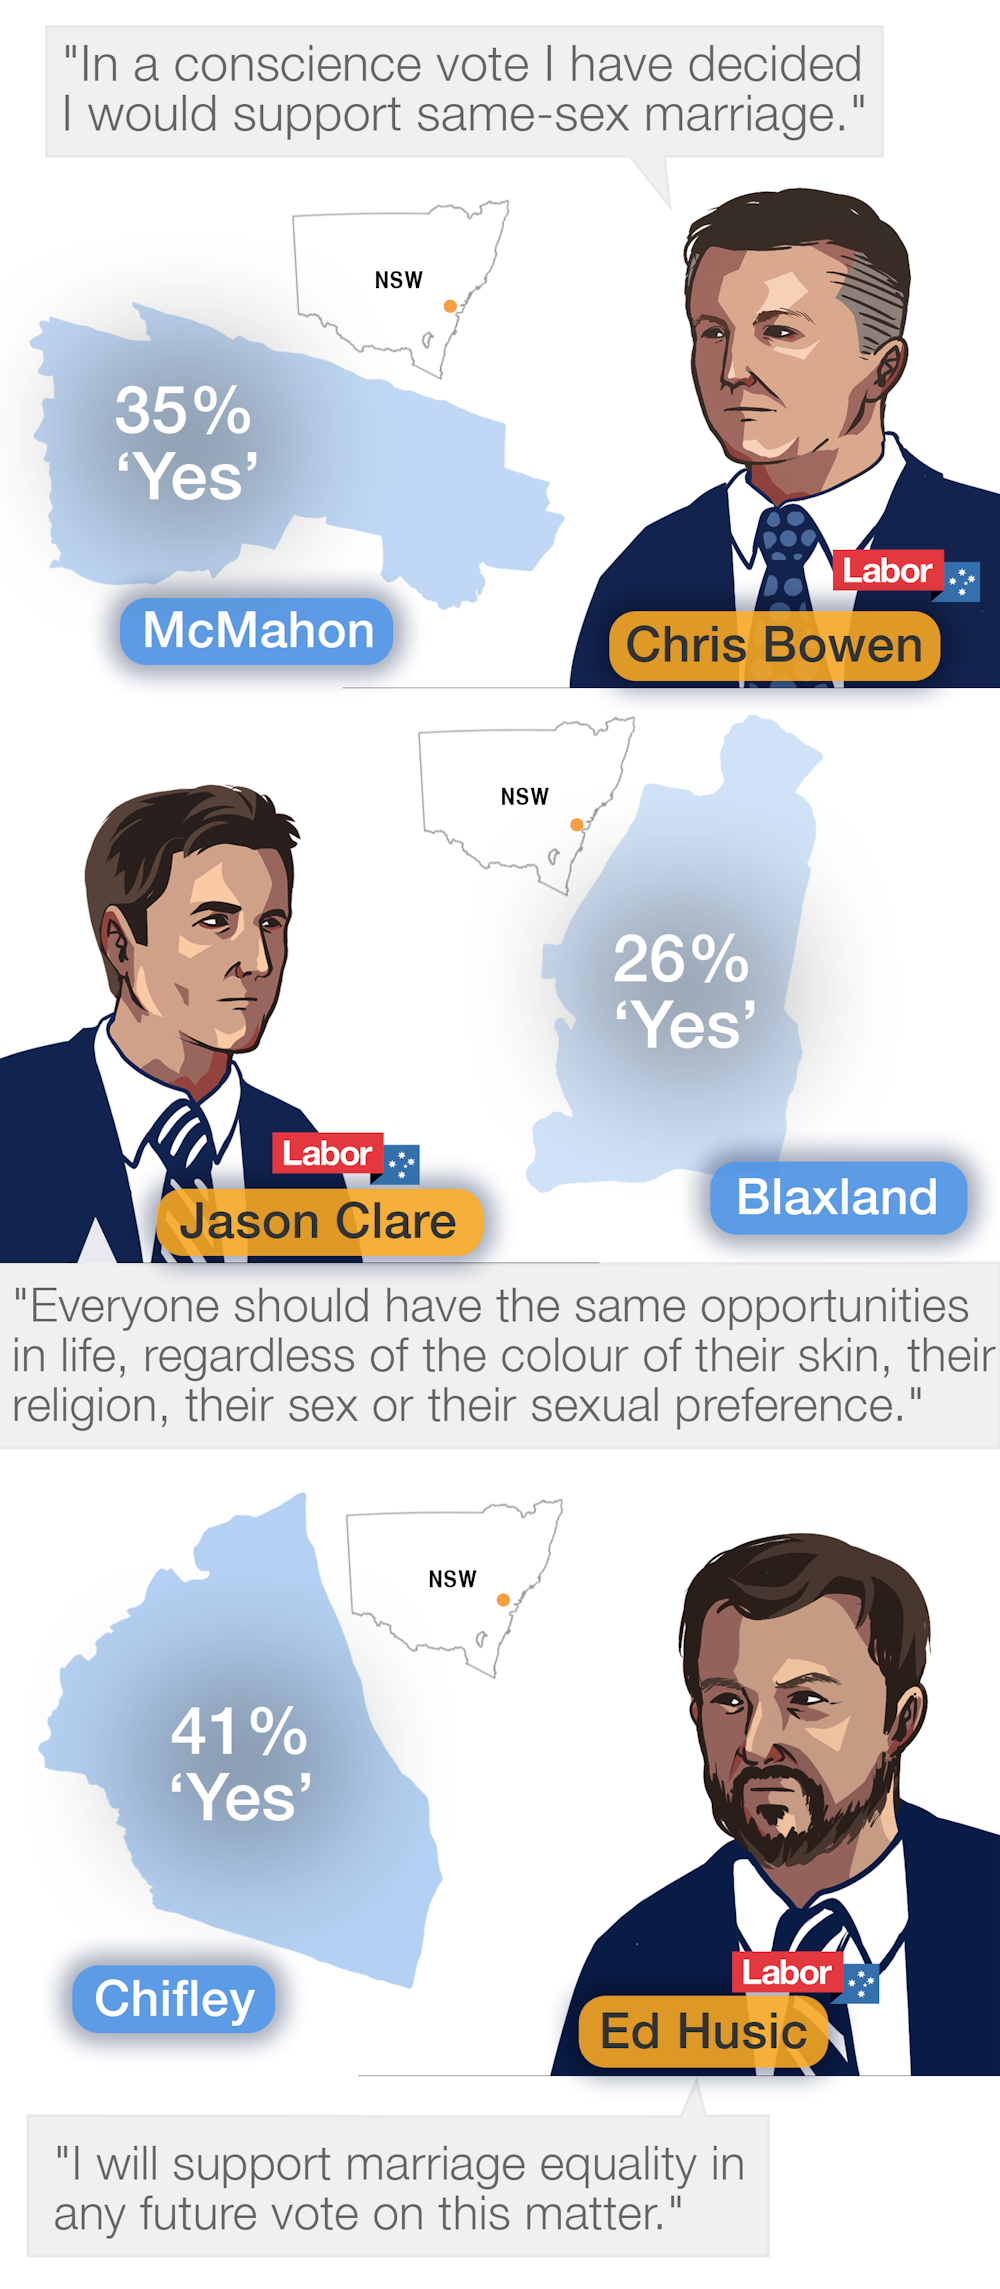
An electoral cycle ago, some of these MPs would have said they would abstain or vote against same-sex marriage if their electorate did not support it. They have moved on. They will take a deep breath and keep their fingers crossed when next they are up for election.
There are already alliances between conservative Christians, conservative Jews and conservative Muslims over some of these social issues.
My sense is we are going to see, over the coming years, some more religious, morally driven political movements around these regions, particularly in Muslim communities – the Muslim equivalent of the Australian Christian Lobby, if you will. We may see similar in Hindu and Sikh communities as well.