
If most commentators are right, the 2015 general election is likely to be one of the most unpredictable and exciting polls of the post-war period. The dramatic rise in support for UKIP in England, the SNP in Scotland and a smaller surge in support for the Greens, appear to foreshadow a dramatic transformation in British politics.
When it comes to explaining election outcomes, different perspectives offer different insights. Journalists, for example, tend to be sensitive to more immediate sources of change, like the attractiveness of party leaders (Neil Kinnock’s failure to persuade people that he would make a good prime minister in 1992), or to a campaign event (the leaders’ debates in 2010).
Political scientists, on the other hand, will point toward longer term sources of change, such as shifts in what the people want from government, or economic conditions.
A matter of perspective
Both the journalistic and political science perspectives have something important to say about elections. But given the volume of journalistic accounts, it is worth emphasising the longer-term perspective. We can do this by assessing what the outcomes of the past – in terms of vote and seat shares – imply for the 2015 election.
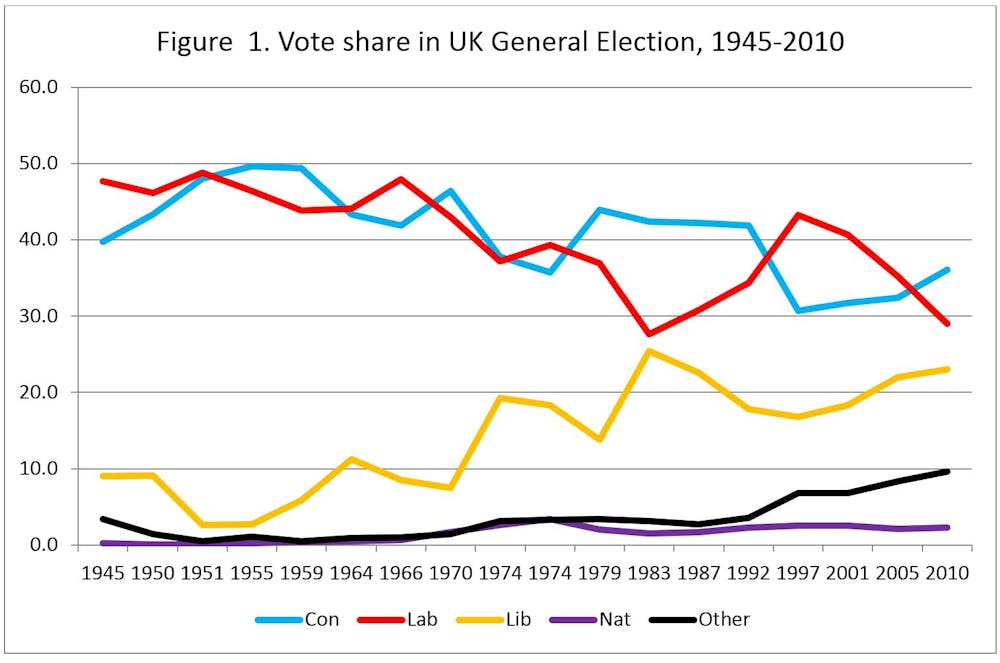
This graph displays the vote shares received by parties in the 18 general elections held since 1945. We can gain several insights here: the most obvious feature is that vote shares for each party in any given election look very similar to those in the elections immediately before and after. The average change in vote shares between elections is just 3.5 points for the Conservatives and Liberal Democrats, and 3.9 points for Labour.
Of course, there have also been some sharp changes in fortunes: Labour lost 9 points from 1979-83, while the Conservatives lost 11 points from 1992-97 and the Liberal Democrats gained 11 points from 1970 to February 1974. But changes of this magnitude are rare; most elections are characterised by small shifts in vote shares.
Another trend - easily forgotten in our current context - is the continued increase in support for the Liberal Democrats. Generally speaking, the centre party has been mopping up votes from both the Conservatives and Labour since the early 1970s.
The third feature is that from the late 1990s onwards, there has been a significant increase in votes for minor parties such as UKIP and the Greens, as well as shorter-lived parties such as the Referendum Party and Veritas. Around one in ten votes have been cast for parties other than the “big three” in every election since 1997. This increase in favour of minor parties pre-dates the more recent decline in support for the Liberal Democrats.
The final feature worth considering is that the nationalist parties have hitherto failed to make an impact in Westminster elections. Indeed, their peak – at least in terms of share of the vote - was more than 40 years ago in October 1974.
Bad news for the big two
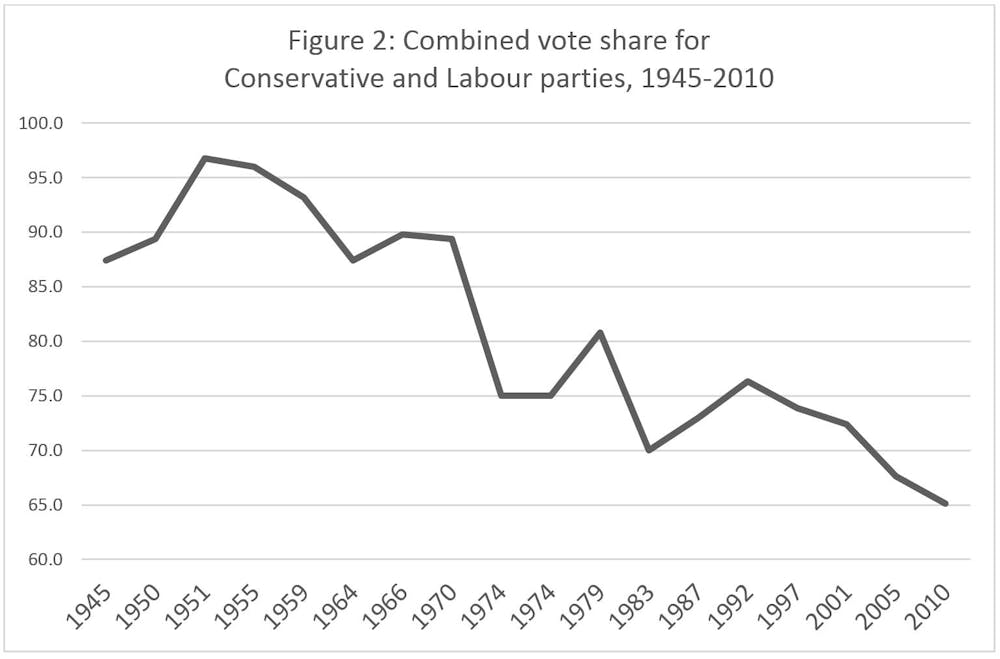
This graph alone does not tell the whole story about post-war elections. Another trend that is easily missed is the decline in the two major parties’ share of the vote from 95% in the 1950s to 65% in 2010. The graph below displays the combined vote shares of the two major parties. Strikingly, the Conservative and Labour parties have not secured 80% of the vote between them at any general election since 1979.
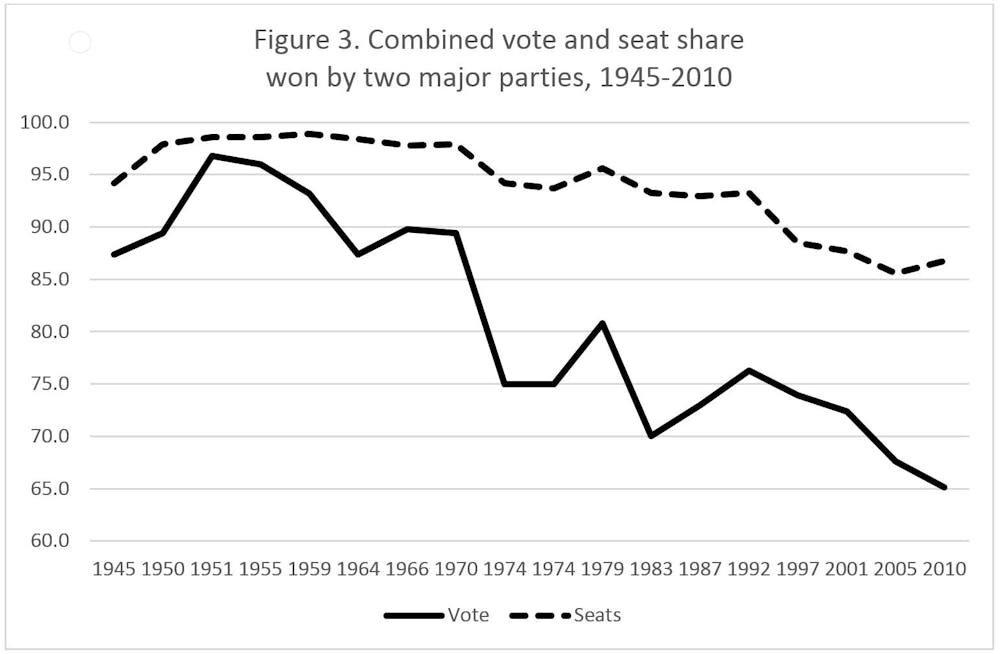
This change is not reflected in parliament because the UK’s first-past-the-post electoral system has advantaged the two major parties. Labour and the Conservatives have continued to dominate the House of Commons and form governments, despite their collective decline in terms of vote share.
As the graph below shows, the two parties secured more than 90% of the seats between them until 1997 and 88% of the seats in 2010. The gap between the two major parties’ seat share and vote share has widened markedly in the last 30 years. Yet both major parties have obtained landslide majorities with as little as 42% of the vote.
Governments lose votes
Another feature of British general elections is the tendency of governments to lose votes. The chart below provides a striking visual illustration of this “costs of ruling” phenomenon. Black columns represent gains, red columns represent losses. The government has lost vote share in 13 out of the 17 pairs of elections. Put another way, governments have increased their share of the vote in only four cases.
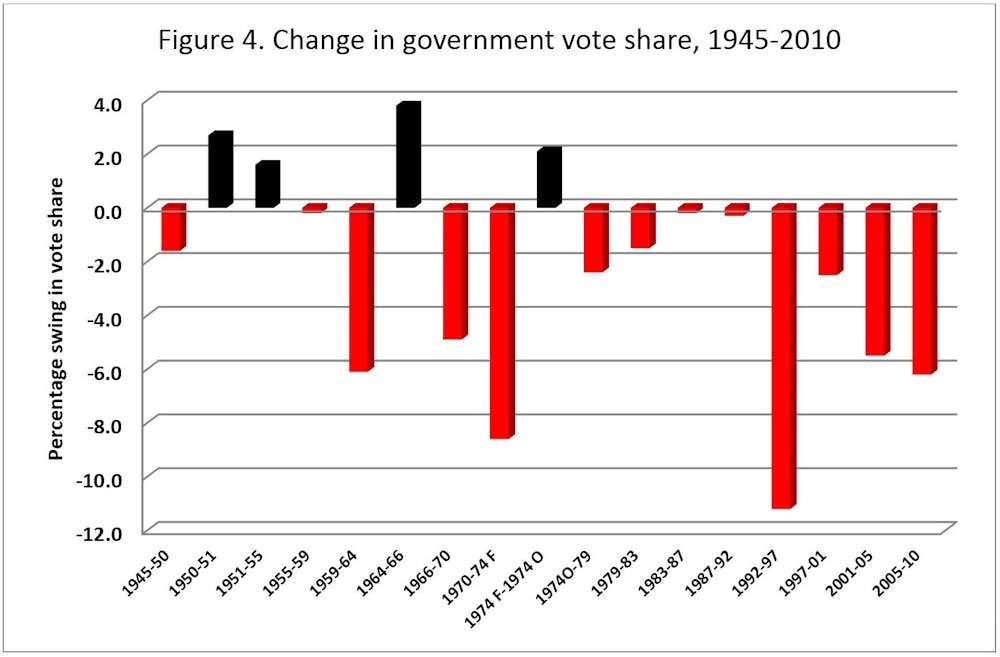
Two of these four cases (1966 and October 1974) were exceptional follow-up elections, held before the incumbents could acquire much of a record. The general election of 1951 resulted in a defeat for the government because the increase in the incumbent Labour government’s vote share was less than the Conservative Party’s. The 1951-55 government stands out as the only case where a full-term government went on increase its vote share and win an election.
On average, across 65 years and 18 elections between 1945 and 2010, the government has lost 2.4 points per election. This is the closest thing to a “law” of elections. It implies that a reduction in government vote is normal and, quite frankly, unexciting.
A long-term forecast
Let us assume, for a moment, that we have no information apart from past election results to guide us. A reasonable guess about the vote shares for the major parties is that there will be an “average change” of 2.4%. This implies the Conservative incumbents should obtain 36.1 - 2.4 = 33.7%, down from 2010. If Labour also perform according to our average, they should get 29 + 3.9 = 32.9% of the vote. These figures provide us with markers to judge the success of the parties’ campaigns.
For the Liberal Democrats, there is no precedent to suggest what happens to their vote share after a period of government. If we assume that their vote will decline by our average, this yields a Liberal Democrat vote share of 23 - 2.4 = 20.6%.
Since either the Conservatives or Labour are most likely to form a government, the long-term perspective suggests that the election will be on a knife’s edge – at least in terms of share of the vote. It also reminds us that the winner in terms of seats will again depend on the operation of the electoral system.
An exciting election
Now let us concede that we do have some additional information about the parties. The UK Polling Report average currently suggests vote shares of 32% for the Conservatives, 33% for Labour and 8% for the Liberal Democrats.
Our projection for the Liberal Democrat vote share seems far too high. It is almost inconceivable that the party will recover 12.6 points in such a short time, though they do tend to gain 3-4 points during a general election campaign. With this in mind, we can suggest a vote share of 12%.
Given the continuing decline in support for the two major parties, it seems safe to suggest that the minor parties will continue to gather support, taking around 21% between them. Yet, as demonstrated, this development is unlikely to alter representation at Westminster very much: the electoral system does not fairly reward the minor parties unless their support is geographically concentrated.
UKIP may pick up a handful of seats and no more. The Greens will do well to retain their single seat, even if they receive more votes than the Liberal Democrats as some recent polls suggest. The only possible exception is Scotland, where the SNP may be able to concentrate its vote and come first in enough seats to significantly increase its tally of MPs, at Labour’s expense.
This will be a closely fought election, which may produce another hung parliament. Though the minor parties are unlikely to win more than a few seats, the post-election behaviour of their MPs may well determine which of the major parties forms the government. That is what makes the 2015 contest so exciting – especially from a long-term perspective.