
How much do we really spend on research and development, and how does it vary internationally? To provide some context for this science funding debate, the Scienceogram team has broken down spending across the G20 countries.
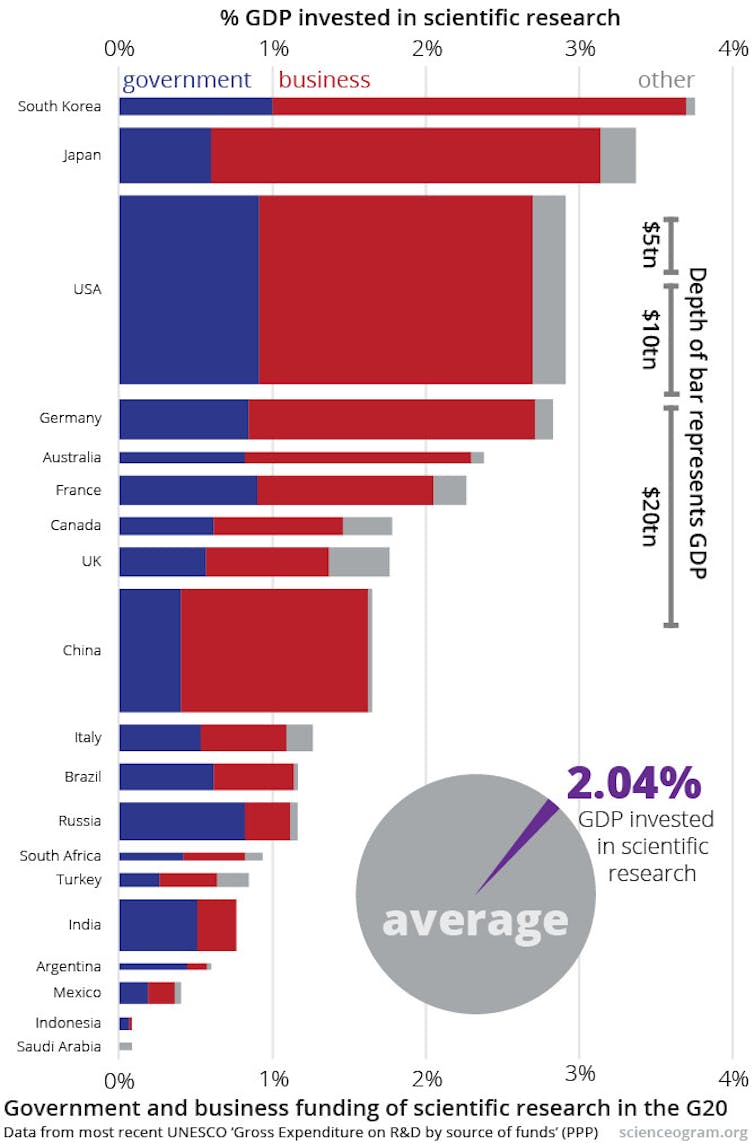
In the chart below, the vertical depth of the bars represents the countries’ GDP, a measure of total national economic output. The width of the bars represents the percentage of that GDP invested in research and development (R&D). That means that the area of each block is proportional to the overall spend on research.
The graph is divided into spending by governments, private businesses and other sources. The averages for these countries are 0.65% of GDP spent by governments, 1.26% of GDP invested by the private sector, and a further 0.13% of GDP coming from other sources.
A few broad conclusions emerge from the data:
The percentage of GDP invested in research and development varies widely across the world. South Korea is powering ahead at 3.7% of GDP. (And its investment is increasing rapidly, up from 2.8% in 2005.) The UK is below average by most international measures, spending 1.7% of GDP on research. Spending is much lower in the less wealthy G20 member states, although time series data show that many are ramping up investment.
In most countries, the private sector makes the larger contribution to the research ecosystem. The exceptions to this rule are Brazil, Russia, India, Argentina and Indonesia.
The US is a global research behemoth, in both the public and private sectors. A healthy percentage of its GDP is sunk into science meaning that, in absolute terms at least, even China won’t be competing with it any time soon.
Dividing research spending into public and private inevitably misses some subtleties. There is a symbiotic relationship between state and business investment in R&D. This ranges from the direct, such as government-sponsored loans and grants for a variety of private projects, to the diffuse, like the education and training provided by public-funded research that underpins a skilled workforce.
The international variation in science policy means that it’s worth taking the sharp dividing lines on the graph with a pinch of salt: no taxonomy of research funding could adequately capture all this detail. Still, these numbers do give an impression of the big picture, and show the widely divergent levels of investment in science internationally.
Andrew Steele co-authored this article with Tom Fuller, an editor and graphic designer based in Oxford. They are founders of Scienceogram UK.
For: Science is vital, just not in the way you think
Counter: Trust the markets to fund science
Sources of data
All the data used for this graphic are available in this Google Spreadsheet.
The United Nations publishes a range of statistics on scientific research and development on the UNESCO online Data Centre. We used the most recent values of “GERD by source of funds” (GERD = Gross Expenditure on Research and Development) for government and business enterprise, and aggregated the other categories (private non-profit, higher education, abroad and “not specified”) to work out where nations sit relative to one another on an internationally uniform scale.
This breakdown by source of funds is not available for Saudi Arabia, which is why its bar is entirely grey. Also, while the European Union is a bloc member of the G20, it is not included this graphic.
We used the most recent figures for all data, but these are not perfectly up to date. For example, all the most recent UK figures are for 2010, so they don’t fully reflect the real-terms reduction in science spending since then. They’re also not always uniformly dated; to take another example, Australia’s GDP and total R&D spending figures are from 2010, but the most recent percentage breakdowns into government, business and so on come from 2008. Data for most other countries are for 2008–2010. This is a limitation of the data, and choosing a different methodology doesn’t significantly change the results.
Finally, while UNESCO make the separation of the “source” of funds and the “sector of performance” obvious, other data sources report in a more confusing fashion. For example, Government Expenditure on R&D (GovERD) refers to R&D performed by government bodies, and does not specify who picked up the bill. Conversely, “GERD financed by Government” (the statistic we used) refers to R&D paid for by the government, irrespective of where it was performed.