

Since the 1920s, the Conservative and Labour parties have dominated the political landscape in the United Kingdom. Their governments tend to be strong, since the country’s first-past-the-post electoral system helps to produce parliamentary majorities which enable the ruling party to implement its policies. Yet surprisingly, after a century of the two parties vying for power, there is a little academic research into which has been better for the UK economy.
This is even more perplexing given that the economic performance of each party is a key factor in UK voters’ political decision-making. Undeterred by the lack of research, however, they have long since reached a conclusion: the Conservatives enjoy a clear political advantage as the party expected to manage the economy better. Even a sizeable percentage of Labour voters have agreed at times.
This could possibly explain why the Conservatives have won the most general elections in the past century: 15 wins to Labour’s eight since 1922, plus four hung parliaments, with the Conservatives the largest party in three of them.
But are the voters right in thinking that the Conservatives are the most reliable party for economic performance? We have just published research into this that analyses the GDP growth achievements of the two parties. The results are not what you might expect.
The basic results
Over the past century of governments, the Conservatives achieved slightly higher mean growth per quarter (0.62% vs 0.56%), Labour achieved a slightly higher median (0.62% versus 0.58%). In other words, when you add together all the quarterly growth numbers of both parties and divide them by the number of quarters in question, the Conservatives come out on top. But when you take the middle number of each parties’ quarterly growth figures, Labour comes out on top. Incidentally, this analysis does not include the impact of COVID on the economy – including that makes Labour’s performance look better.
These differences are not statistically significant, but the discrepancy between mean and median hints at the presence of outliers of particularly strong or weak quarters in the data that are skewing the mean averages. In fact, Labour have achieved a higher concentration of quarters of positive growth than the Conservatives. Indeed, despite the 2008-09 recession taking place on Labour’s watch, the party has only overseen seven quarters of recession in the past 100 years compared to 17 under the Conservatives.
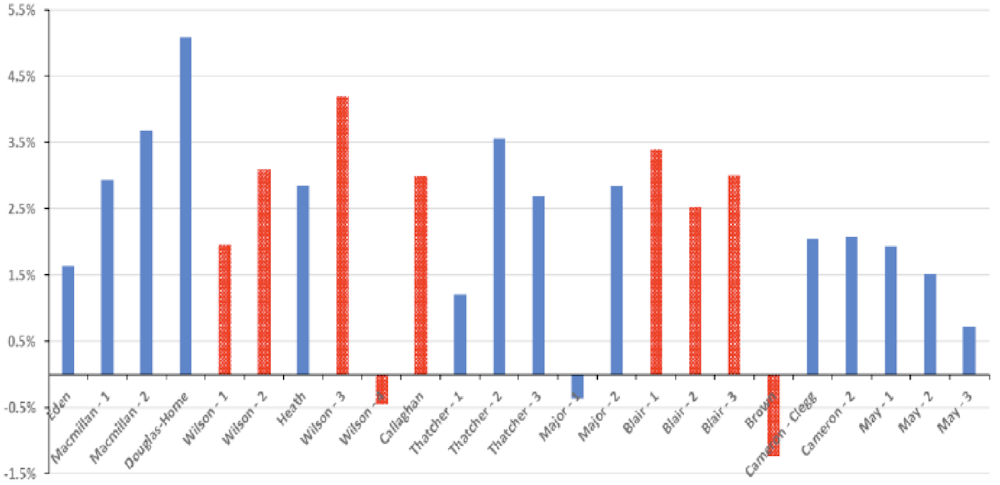
If we disregard the global financial crisis as an external shock, Labour has presided over just two recession quarters since 1955, and has produced average annualised growth of 2.66%. If we similarly disregard the three quarters following the 1973 oil shock that took place under the Conservative administration of Ted Heath, his party has presided over 14 recession quarters and 2.65% of average annualised growth. You can also see the performance of specific governments since 1955, as shown by the average annualised growth numbers, in the graph below.
Growth by administration since 1955
Improving the analysis
So far, our findings have shown that there is no statistically significant difference in the GDP achievements of the two main parties (COVID aside), and that Labour is the more consistent performer. But those who follow politics will be well used to politicians saying, “We inherited a bad situation from the previous government”. What if the performance of a newly elected government is affected by the ongoing policies of the previous administration?
To assess whether the economic performance of either party improves as a newly elected government is given time to implement its policies, we incorporated time-lags into our analysis. The graph below shows the difference in growth rates between the parties when you apply a time lag to their performance – for example, the bars under lag 1 show average growth across a party’s period in office if you reallocate its first quarter to the previous party in office.
Average GDP growth over lagged quarters
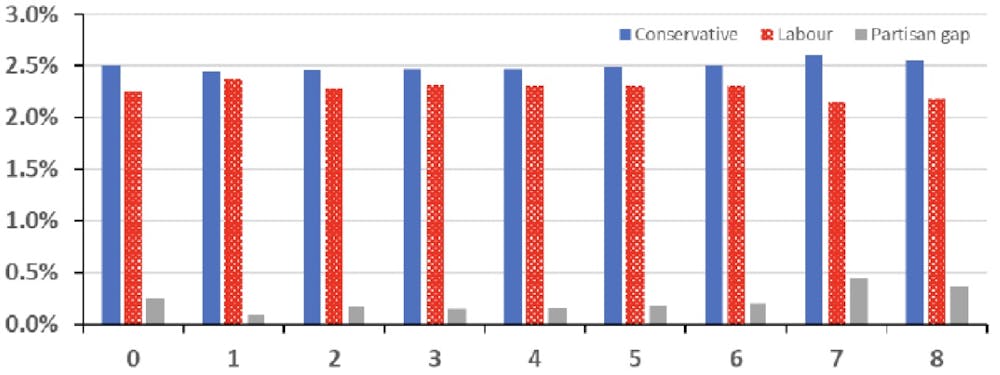
What this shows is that the already statistically insignificant gap in real GDP growth between the Conservatives and Labour tends to close even further if you reallocate up to six quarters of growth figures. If you allow seven or eight quarters, however, the gap seems to widen in favour of the Conservatives. But when we ran some econometric modelling to see whether this was statistically significant, we concluded that it was not: there was no clear winner between the two parties.
To add an additional layer of sophistication, we then resorted to a technique that implicitly acknowledges that new government’s affect on the economy from their first day in office, often through sentiment rather than new legislation. For example, if people think a new government will do a better job with the economy, they might save less and spend more.
But since new policies may well take months or years to yield results, there is a limit to how much sentiment can affect economic performance. To simulate this gradual shift, we used an “annual thirds method”, where the new government is economically responsible for just one-third of growth in year 1, two-thirds in year 2 and then assumes full responsibility only from year 3. Using this analysis, the annualised growth rates for the two parties stayed almost the same as before, and was still statistically insignificant.
In short, the economy grows at a very similar pace under Labour and the Conservatives, but Labour governments seem to do better at tackling recessions and achieve a more consistent performance. And if we discount the global financial crisis of 2007-09, Labour’s (slight) superiority becomes more pronounced. It should be food for thought for UK voters next time they are trying to decide where to put their cross.