
The 2013 student data has been released, which includes information on access for groups of students under-represented in higher education. Lately, most of the attention has been on students from low socio-economic backgrounds, and whether or not the implementation of the demand driven system - or uncapping the number of domestic undergraduate places - has improved access for them by increasing supply and reducing competition.
It has. This is vindication of the demand driven system - and the efforts within the sector - to improve accessibility for this group in both actual and proportional terms.
However, there are five more groups of students officially classified as disadvantaged, for the purposes of “equity”. Not all of these groups have found the demand driven system has been as positive for them. In fact, some have found their slice of the pie getting smaller. The other groups are:
-
Students from a non-English-speaking background
Students with a disability
Women in non-traditional areas of study (IT, engineering, architecture, agriculture, business or related studies)
Indigenous students
Students from a regional or remote background.
What do the numbers say?
The Department of Education recently updated its higher education student data. This shows us how equity groups are faring under the demand-driven system, which was fully implemented in 2012, although legislated in 2010. The percentages show each group’s share of the higher education “pie”.
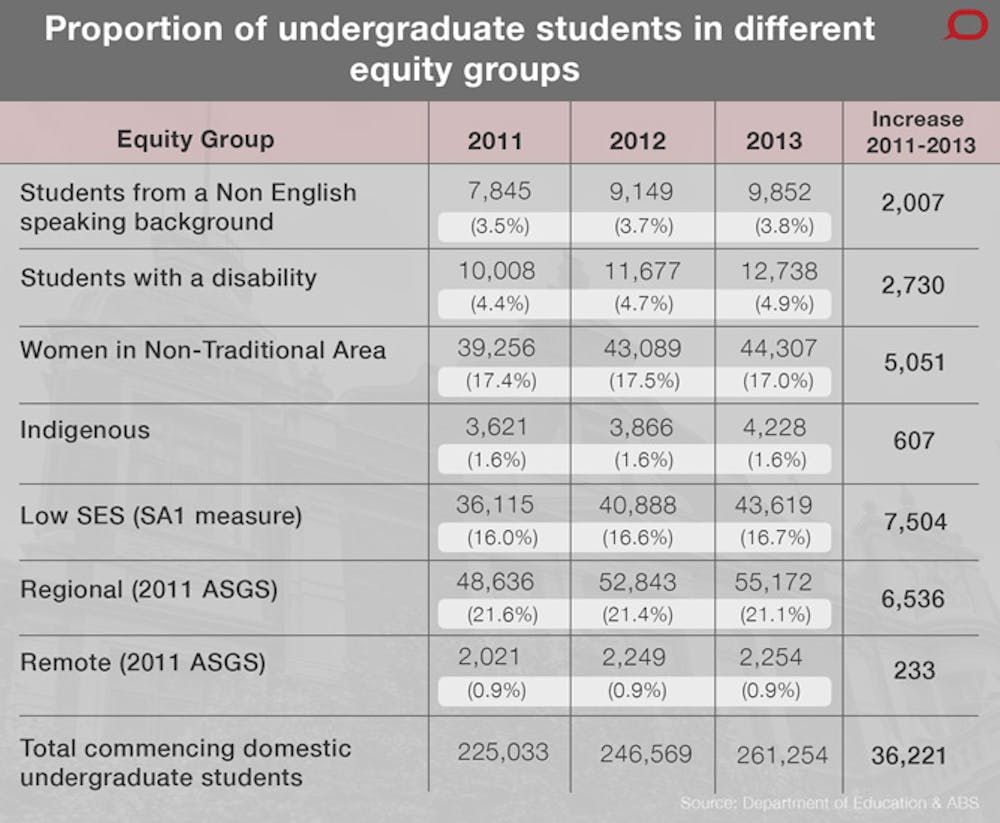
Perhaps the main message people will get from the table above is that the system is successful, from a bottoms-on-seats perspective. It is correct that more places and less competition have resulted in raw-number gains for each of the equity groups. Although it appears that equity student places have increased by almost 25,000 from 2011-2013, the actual number is less. This is because in many cases one student is counted two or three times. For example, one Indigenous student from a regional, low socio-economic area would be counted three times.
Nonetheless, the gains are real. Were we still operating under a capped system, thousands of disadvantaged students wouldn’t be enrolled in higher education today.
Proportional representation
The holy grail for many equity practitioners is to have a higher education sector with a distribution of student places that more closely resembles the wider community. For example, Aboriginals and Torres Strait Islanders make up about 3% of the population. Therefore, all opportunities, rights and aspirations being (theoretically) equal, their representation in higher education should be twice what it is now.
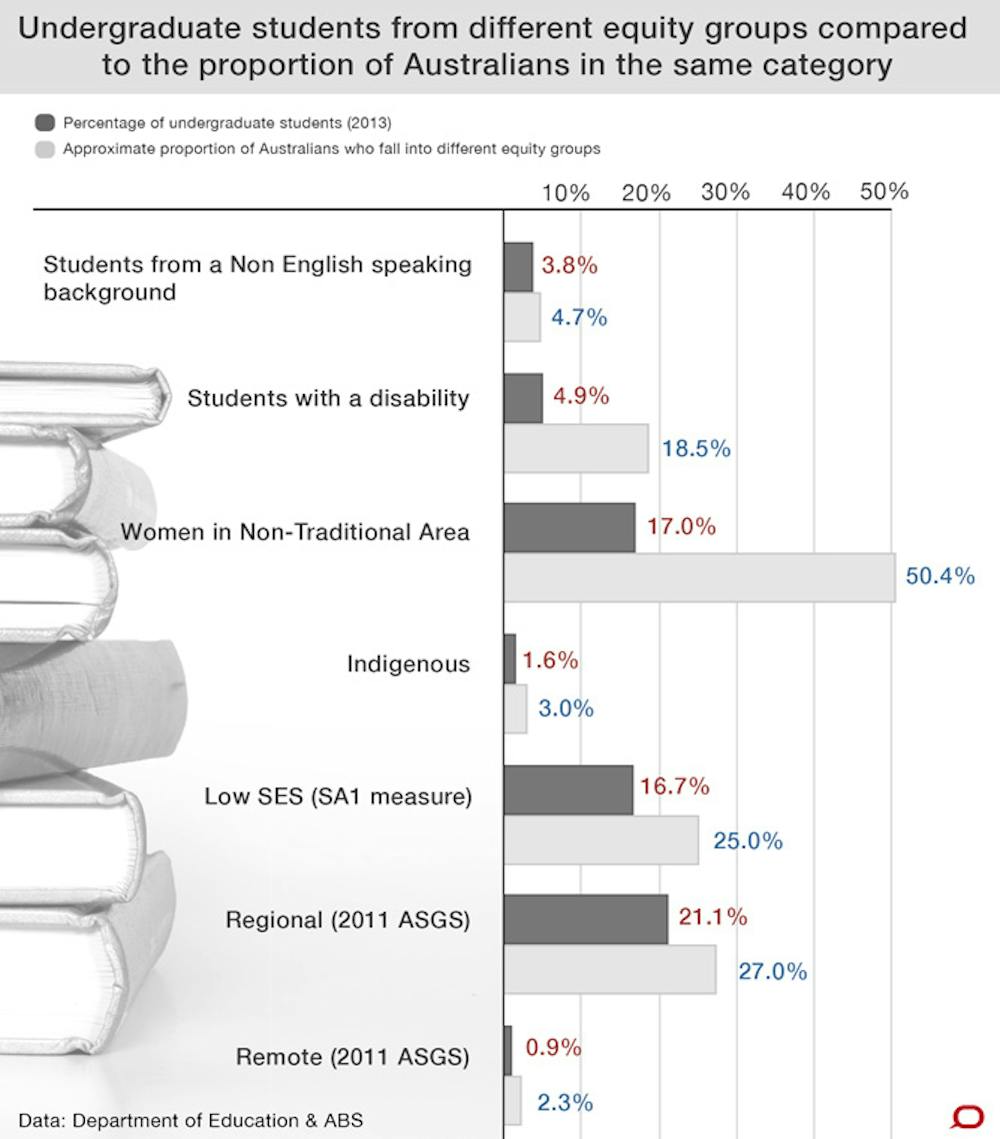
The table above shows the proportional representation of each equity group in the Australian population - though exact comparisons between Department of Education and Bureau of Statistics data are not always possible and so these percentages need to be treated as approximations. Nonetheless, they strongly suggest each group of students is under-represented in higher education.
These trends mirror longer-term patterns predating the demand-driven system. Ten years ago, the demographic makeup of the sector looked similar to today. So in general, the demand-driven system is making our higher education sector bigger, but not much more representative of the wider Australian community. For women in non-traditional areas and regional students, their proportional share is actually going backwards - from 17.5% in 2012 to 17% in 2013 and 21.6% in 2011 to 21.1% in 2013 respectively.
Of course, most causes of under-representation exist outside the sector itself. For example, Indigenous and low socio-economic students suffer from inequities throughout the compulsory school years, while gender disparity in subject selection kicks in much earlier than university.
What can universities do?
In 2011, each university signed a mission-based compact with the government. This agreement included targets for low socio-economic student enrolments plus one or more other disadvantaged groups negotiated between the government and the institution. Twenty-one chose Indigenous students, 11 chose regional/remote students, then three each for non-English speaking students and students with disabilities. Not one institution selected a gender-based target.
In 2011 and again in 2013, universities were awarded funding through the Higher Education Participation and Partnerships Program. More than $100 million was awarded to fund outreach and access projects for low socio-economic and Indigenous students. These are slow-burn projects and patience is required. Hopefully, matters will improve over the medium to long term for low socio-economic, Indigenous and regional students.
However, notwithstanding the efforts of practitioners at the coalface, it is worrying that there is less sector-wide coordination for the remaining groups of equity students.
Should the Commonwealth scholarship proposal be implemented, there will be the opportunity to create a new generation of scholarships specifically targeting women in science and engineering, or students with disabilities for example.
By all means let’s continue to shine a light on low socio-economic students and celebrate the wins. At the same time, let’s not forget the other groups of disadvantaged students.