
In 2016 the Department for Education (DfE) will radically overhaul their school league tables and replace their five A* to Cs grades measure with a new approach measuring results across pupils’ best eight subjects. This new approach highlights the wide disparities in attainment across England’s schools.
The DfE released their latest school league tables in January, covering all state secondary schools in England. For more than 20 years, the headline measure of pupil attainment has been the percentage of pupils achieving five GCSEs at grade C or better, nowadays including English and maths.
The new Attainment 8 measure will report the average GCSE grade per pupil (capped at their best eight qualifications) in each school. As with five A* to Cs, the suite of subjects must include English and maths GCSEs, but now they must also include three further EBacc subjects chosen from the sciences, computer science, geography, history and languages.
While not due until 2016, the Government has quietly published its new measure this year, allowing researchers to compare the two.
The five A*-C measure
This year’s tables show 61% of pupils in England achieved five A* to C grades, up from 59% last year. However, in the lowest-achieving schools, less than 45% of pupils achieve five A* to Cs, whereas in the highest achieving schools, over 80% of pupils achieve the grades. It is important to realise that this variation is driven more by differences in schools’ intakes than it is by differences in school quality – more of which later.
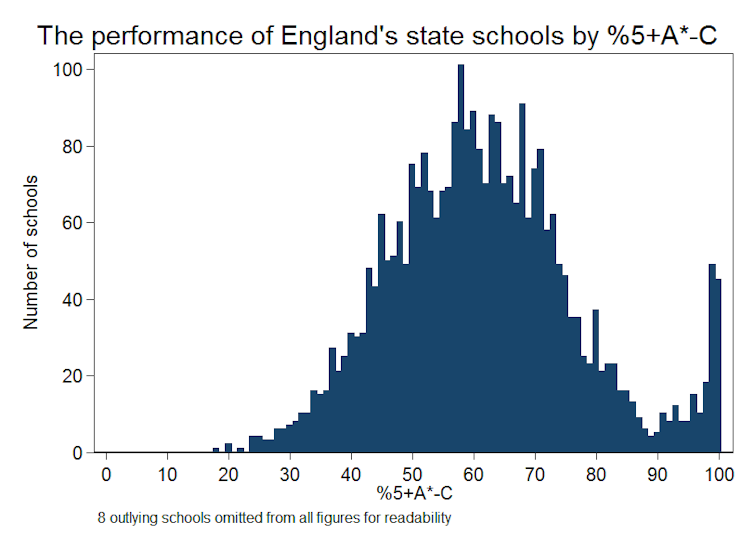
While the comparison between schools based on their pupils’ attainment of five A* to Cs is straightforward, there is an argument that this measure creates perverse incentives which encourage schools to act against the best interests of their pupils.
Schools are incentivised to focus excessively on pupils performing around the five Cs borderline at the expense of other pupils. By focusing on a pupil’s five best results, schools are encouraged to offer a narrow curriculum. And while two of the five subjects included must be English and maths, there are few restrictions on the other three, incentivising schools to push pupils into “easier” subjects.
The Attainment 8 measure
The new Attainment 8 measure should address some of the perverse incentives created by the old five A* to C measure. Schools will be rewarded by raising the grades of all their children, not just those around the borderline of getting five Cs. Based on pupils’ best eight subjects, Attainment 8 should provide a broader summary of pupil learning, and the focus on Ebacc subjects should encourage schools to teach “harder subjects”.
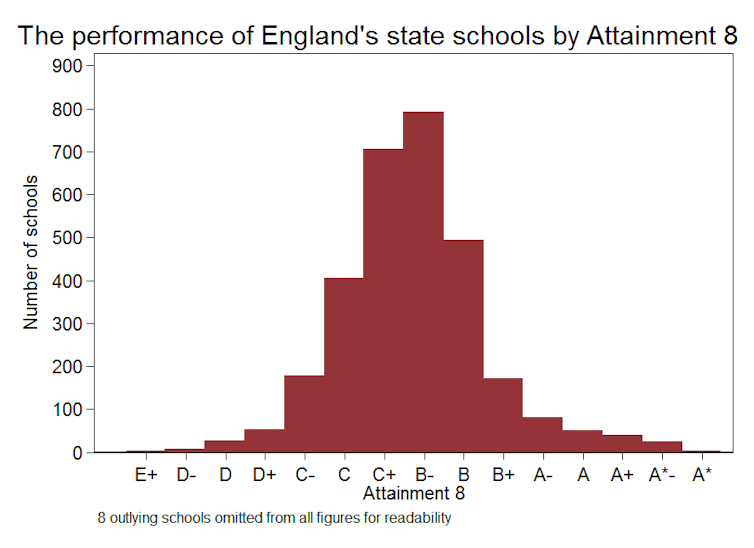
This year’s tables show the average pupil in England scored a C+ under the new Attainment 8 measure. This corresponds to eight good C grades. However, this overall average again masks substantial variation in attainment across schools. The lowest attaining schools averaged at most C grades, whereas the highest attaining schools averaged B+ grades or higher.
Eight versus five
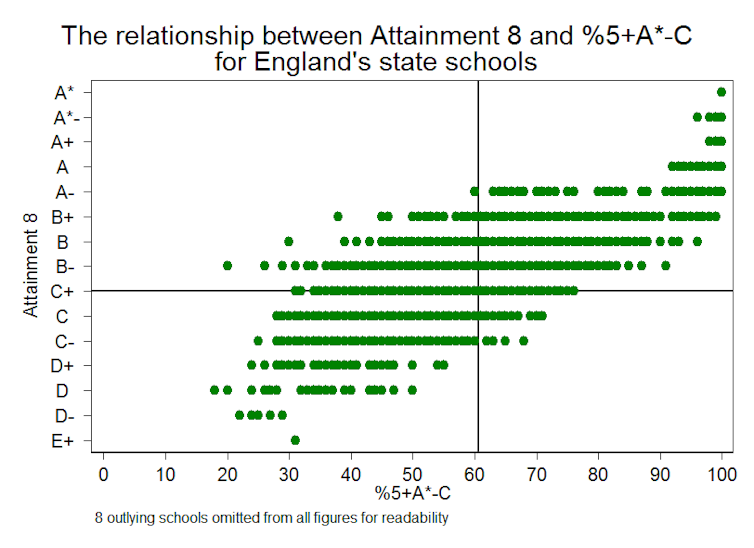
It is interesting to compare how schools perform on Attainment 8 and on five A* to C. The correlation of 0.76 between these two measures, while high, does not guarantee that schools performing well in terms of five A* to C will also appear strong under Attainment 8.
Consider those schools where approximately 61% of pupils achieve five A* to C grades, the national average. The Attainment 8 scores for these schools vary from as low as C- to as high as B+.
On the other hand, schools with an average Attainment 8 score of C+, the national average, have anywhere between 35% and 75% of their pupils achieving five A* to C grades.
Clearly, the two measures provide different information on schools’ attainments, and a school’s league table position will be sensitive to which measure is used.
The graph below shows that some schools can do well in one measure, but not so well in another. For example, some of the schools that perform above average under Attainment 8, achieving an average B-, can have less than half of their pupils achieving five A*-C grades.
While Attainment 8 addresses some of the criticisms made of the five A* to Cs measure, more general concerns remain about comparing schools by their average attainments.
Fundamentally, most of the variation in both attainment measures will be driven by variation in school intake. In the last few years, the government has published various “value-added” and “progress” measures to adjust for the different prior attainment composition of a school’s intake of pupils. These adjusted measures lead to fairer and more meaningful comparisons between schools. However, they have always played second fiddle to the headline five A* to C measure.
Going forward, the government appears committed to place more emphasis on progress measures than ever before. They will introduce a new measure called “Progress 8” to complement Attainment 8. Importantly, the government plans to revise the “floor standards” by which they judge schools to be underperforming, so that it will be based solely on this new measure of progress.
However, a debate remains to be had about the extent to which socio-economic differences should also be accounted for in such measures. The government argues that adjusting for socio-economic differences entrenches lower performance among the disadvantaged. Others would argue that failing to account for socio-economic differences penalises schools which teach higher proportions of these pupils.