
My colleagues and I marked 100 days to the next general election by publishing a suite of reports comprehensively documenting the social policy record of the current coalition government, as we have done previously for its Labour predecessors. The reports record – for nine different areas of policy – the aims, policies, spending, outputs and the effect on socio-economic outcomes so far as they can be established to date. Here, I lay out some of the key points that voters might take from these analyses to help their decisions in May.
There are plenty of choices for politicians to make, and political parties could still divide along some major fault-lines. One is the issue of how quickly the deficit and debt should be tackled. But even if we accept the current deficit reduction targets, there are very different ways of getting to those numbers – which will have profound consequences for social policies and the people on the receiving end of them.
Spending cuts or tax increases?
A key decision will be how much to take from public spending cuts and how much from tax increases, in order to reduce the deficit. The coalition’s decision in 2010 was 77% from cuts and 23% from tax. As part of its approach to tax, the government actually reduced the top tax rate from 50% to 45% from 2013-14, and progressively increased the income tax threshold.
Raising the tax threshold occasionally helps lower earners, although most often they lose about two-thirds of the value of this change. Any “untaxed” income is immediately subject to claw-backs in the subsidies which the government also pays them to top up their low wages. So, the main beneficiaries of a lower threshold are higher earners, and it has been an expensive policy.
Looking overall, our analysis shows that in the period to 2014-15, these direct tax cuts – combined with changes to state pensions – entirely cancelled out the savings that were made to the public purse from cuts to benefits, making no contribution to reducing the deficit. This may surprise some voters who have accepted that cuts to benefits were necessary to help the country’s financial situation.
Winners and losers
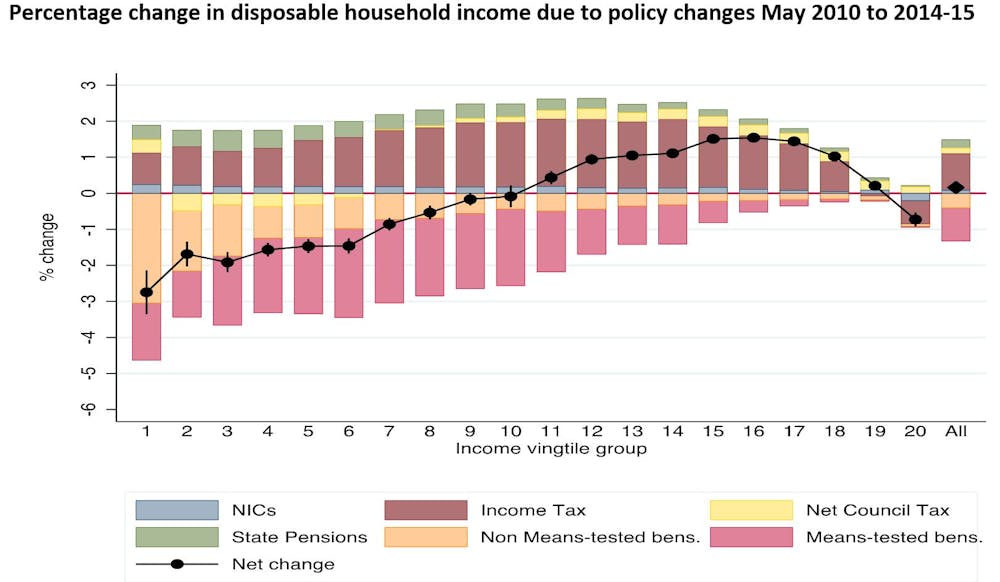
Whoever is elected in May will inevitably make decisions about who should bear the burden of deficit reduction. When announcing his budget in June 2010, the chancellor of the exchequer, George Osborne, acknowledged that it is often the poorest – “those who had least to do with the cause of economic misfortunes” – who are hit hardest, and undertook to avoid this. But our analysis of the government’s actual changes to direct taxes and benefits suggests that the opposite has happened.
Poorer households lost most, taking all the direct tax and benefit cuts together, with the bottom 20th of the income distribution losing on average 3% of their incomes. Apart from the top 20th, households in the top half of the income distribution gained overall.
Which services should bear burden?
The new government will also have to decide what to cut. The coalition government made high-level decisions – to increase spending on pensions and the NHS (although at rates much lower than in recent times) and to protect spending on schools. These are the big pillars of the welfare state. Pensions and other pensioner benefits account for more than 10% of all departmental spending (including defence, home affairs and all others), health for 18% and education for 11%.
The result of protecting these areas, while also trying to take most of the savings from spending cuts, has been large-scale cuts to “non-protected areas” – local government down 33% overall, Sure Start by 32%, housing and community amenities by 36%. The large differences between protected and unprotected functions are shown in the graph below.

The difficulties with this approach are now becoming apparent. The NHS is struggling with average annual growth rates in spending of 0.7% per year in the face of a rising elderly population (compared with 5.7% per year between 1997-98 and 2009-10). At the same time, caseloads in adult social care (delivered by local government) have fallen by a quarter, creating pressures on accident and emergency departments and hospital discharges.
While the government has increased funding to schools with disadvantaged pupils through its Pupil Premium, it has also cut spending on under-fives by 21% overall. Our analysis shows that families with the youngest children have been the hardest hit overall by the tax and benefit changes. Those with a baby were especially affected by specific cuts to grants during pregnancy and the first year of life – another surprising finding for a government committed to “the foundation years” and which has rolled out free nursery places to disadvantaged two year olds.
Reforms to higher education funding have reduced the government’s short term spending by 44%, as tuition fees have trebled, financed by student loans. This appears to have had no detrimental effect on the numbers of young people going to university, including from low income backgrounds. But there has been a 40% fall in the numbers of part-time and mature-age students going to university, and the number of adult learners in vocational education and training fell by 10% in 2013-14 after the introduction of loans to pay for their courses.
All of this suggests that determining cuts by government department is a crude approach, and voters in this May’s election are entitled to ask how a new government will develop a coherent strategic approach to achieving its social policy goals.
So, far from being a battle between parties with the same policies, this year’s election should see the voters presented with some major choices. Our detailed analyses of how the first five years of austerity have played out are designed to help them examine the likely consequences of the options presented to them.