On the back of four years of dry and the shadow of El Niño looming large, recent rains across parts of inland Queensland must come as great relief. While plenty of follow up will be needed to restore surface water stores and recharge aquifers, we should be thankful for such mercies.
As I sat down on Thursday morning (November 5) to start this piece, it began raining proverbial “cats and dogs” in Melbourne, bringing relief to parts of Victoria, including my garden (the 2-3 cm of rain that fell across Melbourne was twice as much as fell in all of October).
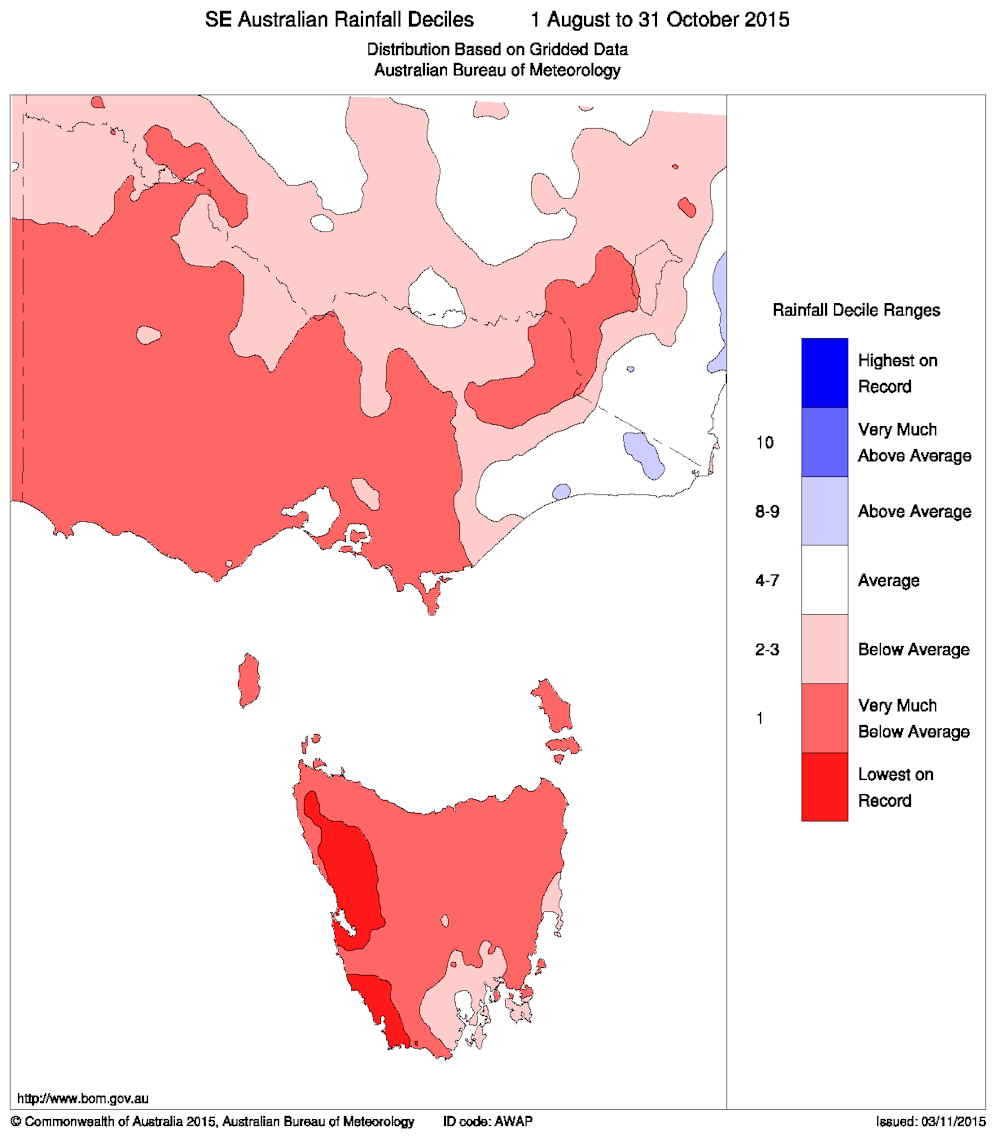
However, the news is not so positive in Tasmania, which seems to have largely missed out on rain again, after several near record dry months.
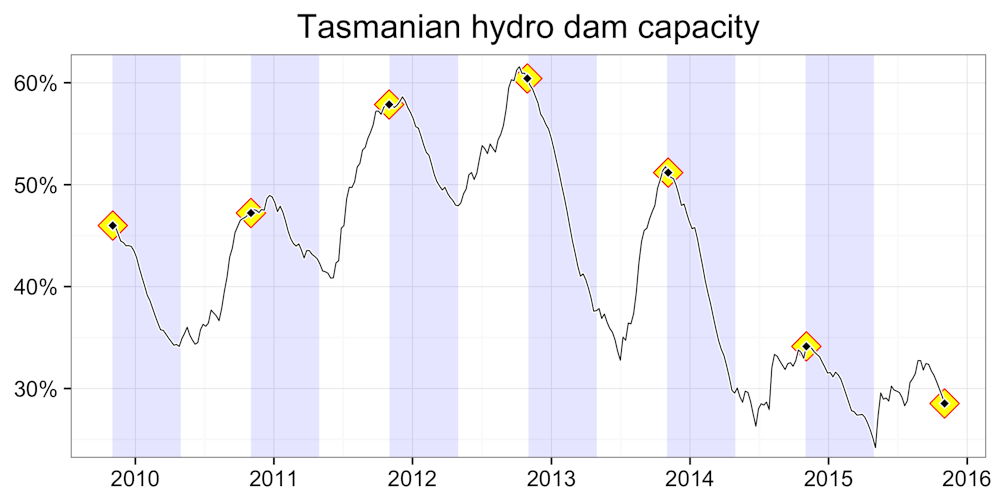
And that is compromising the health of Tasmanian hydro storages. By the end of October, Tasmanian hydro capacity was already below 30% capacity, and falling calamitously, despite a dramatic reduction in Tasmanian hydro power output.
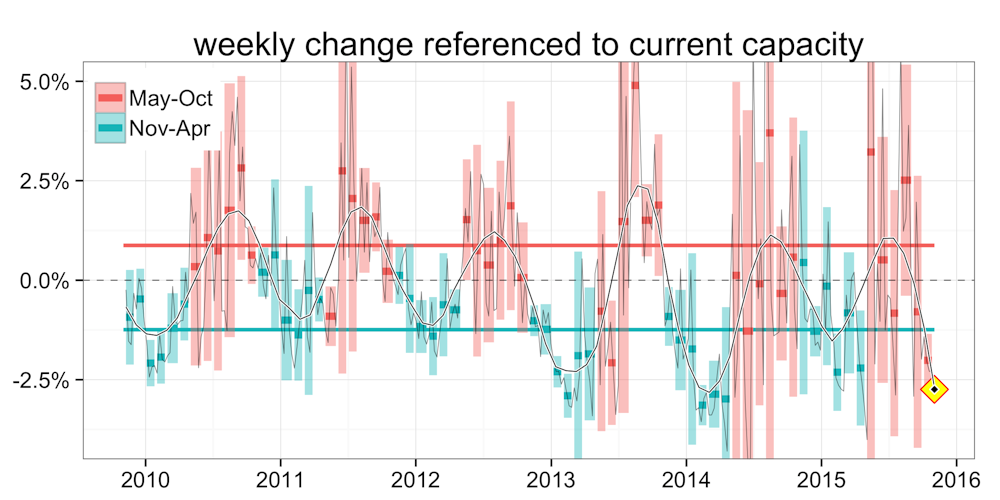
In what I presume is an attempt to shore up storage capacity, Tasmanian hydro output has been substantially reduced in recent weeks. And that has implications for energy flows and generation across the National Electricity Market. Because reduced hydro output is compensated by Latrobe Valley brown coal generators, and further along the chain by black coal generators in NSW, CO2 emissions from our electricity sector have rocketed.
In my last post, just a few days back (“Winds of change”), I commented on the way wind was impacting the Victorian energy market at the margins. While wind generation was lowering the emission intensity of Victorian power supply, it was overwhelmed by countervailing forces unleashed by the uncertainty of carbon policy.
And that has everything to do with the way the hydro resources have been used, quite legitimately, over the years of carbon pricing when capacity of hydro dams was drawn down.
The problem now stems from the fact that our largest hydro reserves in Tasmania have yet to recover following repeal of the carbon tax in mid 2014. With developing El Niño conditions, no one can be certain when that recovery will occur.
More concerning is the prospect that Tasmania may be experiencing a long term shift in precipitation of the ilk seen in south-western Western Australia over the last 50 years.
Energy flows
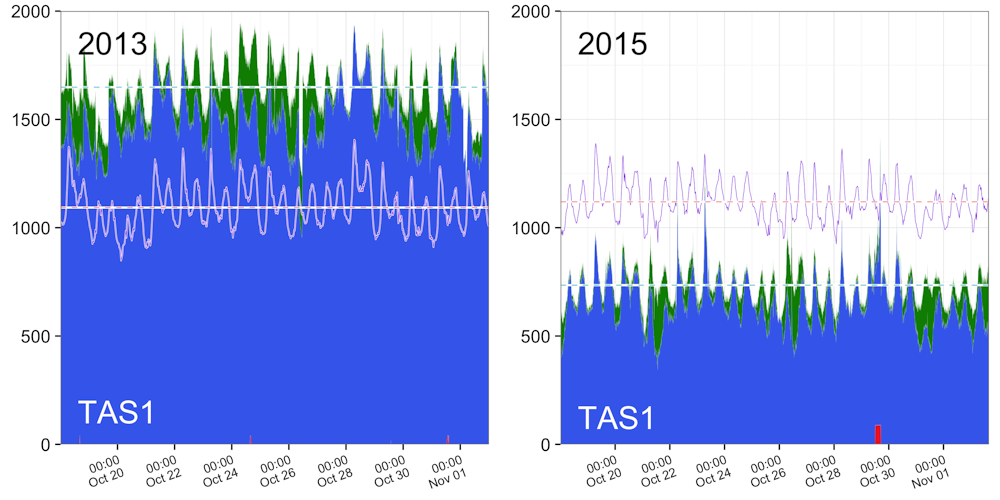
The figure below compares the dispatch from all Tasmanian generators (hydro, wind and gas) over the last fortnight in October in the years 2013 and 2015. The key point is that Tasmanian dispatch is now running at about half the level it was in the carbon tax years, only serving about 2/3 of Tasmanian demand in the period shown.
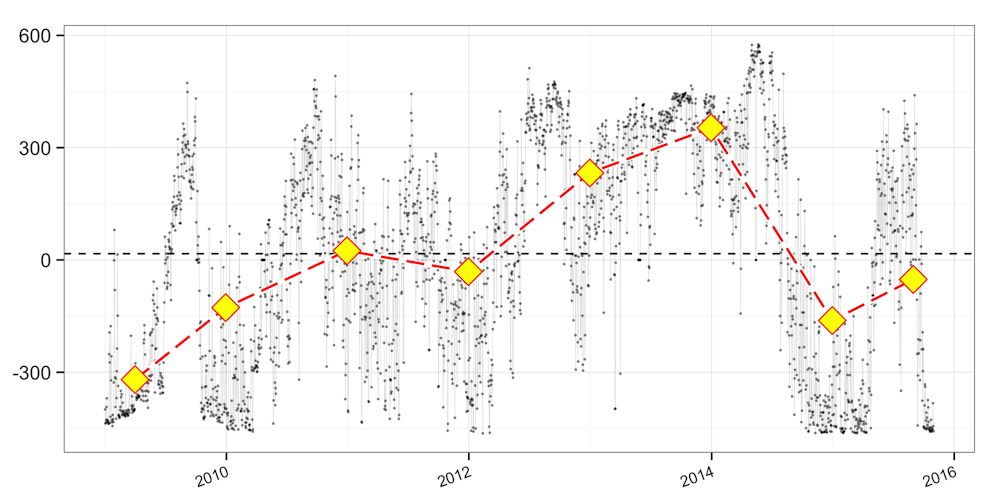
In order to balance demand, energy flows across the Basslink interconnect have reversed, from northwards at near full capacity in the carbon tax years, to southwards at near full capacity in the last fortnight.
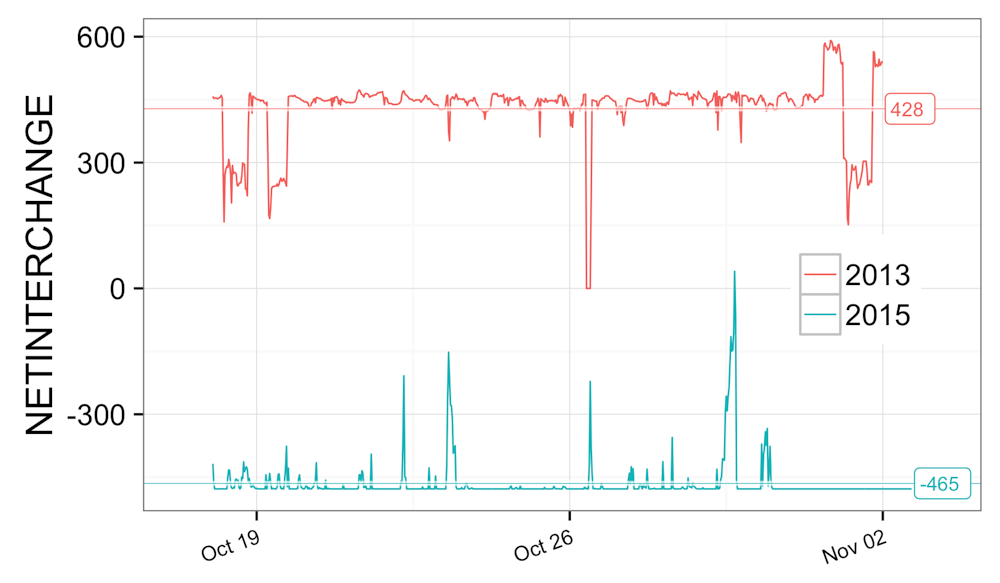
The change in Tasmania’s electrical power balance is quite phenomenal. The halving in hydro output for the periods shown here was balanced by an aggregate 890 megawatt reversal in flow across Basslink. To put that in context, Tasmanian electrical power demand averaged only 1100 megawatts for the periods shown. At 465 megawatts, the average southerly power flow across Basslink in the last fortnight represents over 1/3 of Tasmanian consumption.
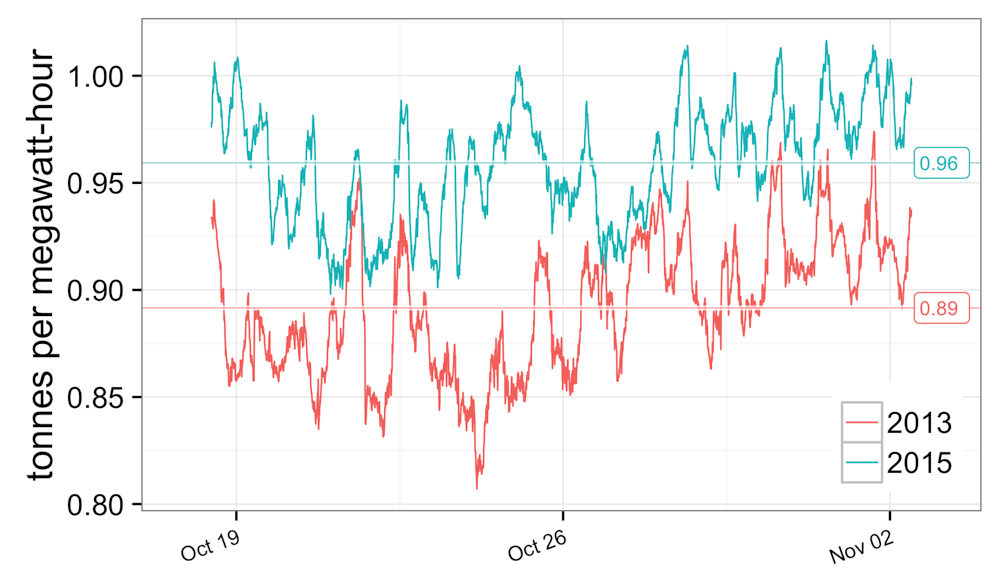
And that has implications for power generation elsewhere on the grid. With the deficit in Tasmanian power production picked up by mainland coal generators, the emissions intensity across the NEM has risen from 0.89 to 0.96 tonnes CO2 for each megawatt hour of power production, for the periods shown here. That equates to about 11 million tonnes extra CO2 over a year.
Changing Climates
Much of southern Australia appears to be experiencing progressive long-term drying.
The drying trend is most pronounced in south-west Western Australia where it has dramatically affected stream flows in to reservoirs. There the decline is astonishing - since 2000, the stream flows have been at around 30% of their average for the period 1911-1971.
In Tasmania, the drying trend is less severe, but it has impacted the flows in hydro catchments and the drying is predicted to continue across the remainder of this century.
In the south-west of Western Australia, the drying trend can be tied to the reduction in the number of winter storm tracks affecting the region, as the tracks shift south into the Southern Ocean. That shift has been variously linked to the rise in greenhouse gas concentrations, to Antarctic ozone depletion and to natural variability.
In a recent study in Nature Geoscience, Delworth and Zeng argue that the greenhouse gas forcing captures the trends and patterns of variability of rainfall in Western Australia in ways that natural variability and other forcing does not (see also David Karoly’s commentary). If their analysis is on the money, it suggests we can expect the continued southward push of winter storm tracks will increasingly spread its drying influence across southern Australia, progressively impacting states to the east.
The question that should be worrying those concerned with our energy system, is what will be the likely scale of this shift. If the experience of western Australia is to be replicated in Tasmania, even in small part, then it will make the challenge of balancing energy security with the needs to reduce emissions just that little bit harder.
While the current state of Tasmanian hydro dams is likely impacted mainly by natural variability, as well as Hydro Tasmania’s dispatch strategy during the carbon pricing years, the worry is that we are glimpsing a future of less productive hydro generation.
Addendum
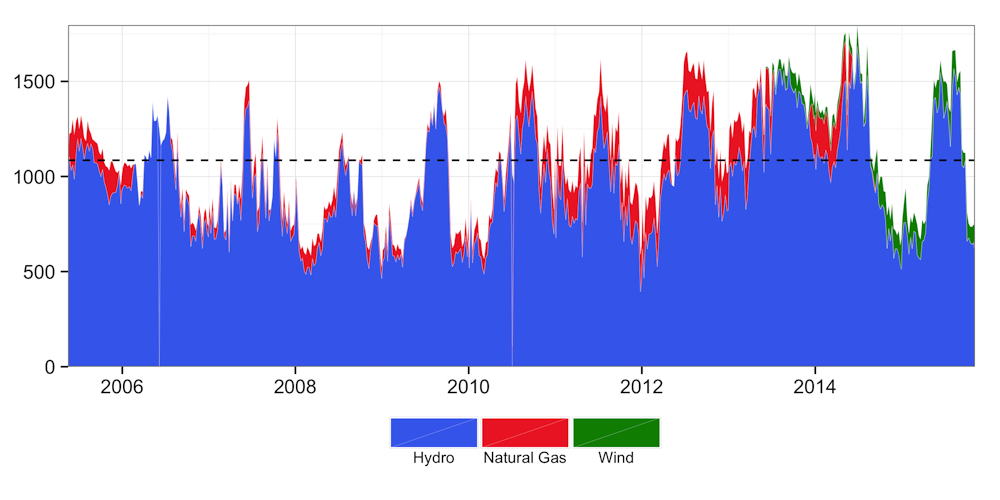
In response to some of the discussion in the comments, I have added some additional figures, showing Tasmanian dispatch by generation type since 2005 (when Tasmania joined the NEM), and Basslink flows since 2009 (the extent of the data I have readily available).