
The year 2015 has proven to be another year of temperature records. Data released by NASA and NOAA (National Oceanic Atmospheric Administration) show that in 2015, the global mean surface temperature – the yardstick scientists use to measure air temperature year to year – was the warmest on record by far.
The data show not only that 2015 is the hottest year on record, but also that the increment over the previous hottest year (2014) was perhaps the largest on record.
It is readily apparent that global warming is alive and well (not that this is a good thing). These latest temperature figures also indicate that the so-called global warming hiatus is due to natural variability, rather than a slowdown or reversal of global warming from the buildup of greenhouse gases.
So how did this play out in last year’s weather events?
Signs of a hotter planet
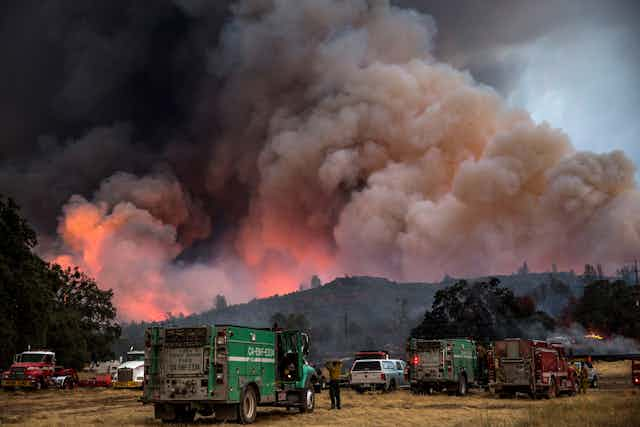
As might be expected, record high temperatures were observed in many places around the world last year. Severe drought and accompanying wildfires were widespread.
Perhaps not so obvious, torrential rains also occurred, at least in part as a consequence of the warming. Warmer air can hold greater amounts of water vapor, at a rate of about four percent per rise in temperature of one degree Fahrenheit, which can lead to heavy precipitation.
These tangible signs of the effects of climate change are to be expected and have been predicted by climate scientists because of the continuing increases in heat-trapping greenhouse gases, most notably carbon dioxide, from the burning of fossil fuels.
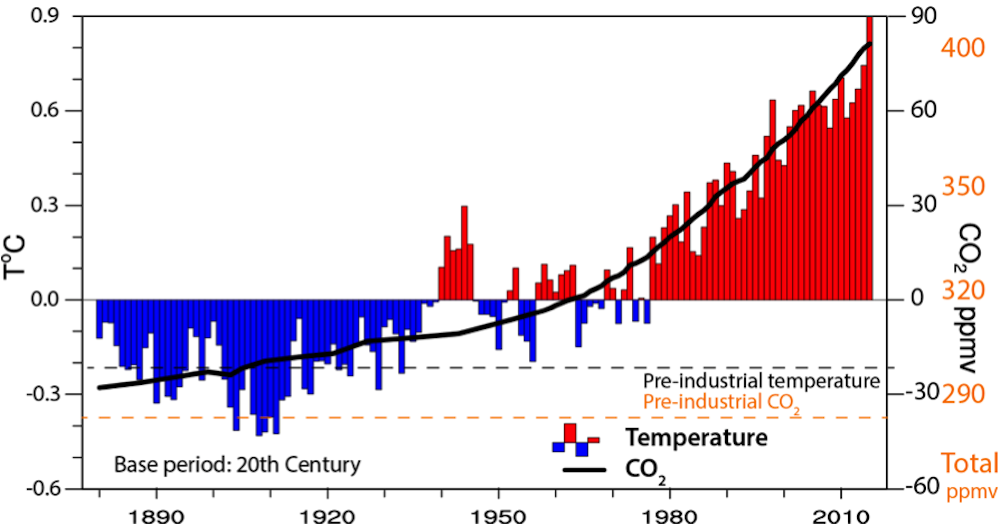
Indeed, as the figure above shows, throughout the years records have been broken time and time again. This is very much in tune with what the climate models have been suggesting.
The latest data should also dispel all the suggestions that there was no global warming because of the pause, or “hiatus,” in the rise of global mean surface temperature (GMST). There may have been a pause in the rate of warming from 1999 to 2013, but such things are expected from natural variability.
Role of El Niño
The year 2015 stands out because of the unusually strong El Niño that has been under way, only the third El Niño categorized as “very strong” going back as far as records allow (into the late 1800s). In fact, the higher temperatures from El Niño could account for most of the difference from 2014, which had been the warmest year on record until last year.
El Niño plays a major role regionally in affecting where the hot and dry spots are and where the torrential rains and hurricanes occur. Global warming makes all of those effects more brutal.
Although there are always a lot of other facets of natural variability and weather at work, the combination of global warming and the El Niño dominated what was experienced last year. This combination played out in a number of outstanding weather events throughout the world last year.
Cyclone Pam devastated Vanuatu in March 2015 with category 5 strength. Indeed, the Northern Hemisphere tropical storm season was a record-breaker, mainly from enhanced activity in the Pacific and record numbers of category 4 and 5 hurricanes or typhoons. In turn, these made landfall with devastating consequences, including flooding, in the Philippines, Japan, China, Taiwan and other areas. Now a vigorous hurricane season is already under way in the Southern Hemisphere with several Pacific islands falling victim to the strong winds and heavy rains.
In the summer, there were deadly heat waves in many places throughout Eurasia: Europe (Berlin 102°F; Warsaw 98°F; Madrid 104°F); Egypt; Turkey, Middle East (Iran 115°F); Japan: Tokyo longest period over 95°F; India 122°F (2,300 dead; May-June).
In the Northern Hemisphere spring, record rains and flooding in Texas and Oklahoma, in particular, were no doubt linked to the El Niño plus warmer oceans.
South Carolina suffered major flooding from October 3-5, while Missouri and surrounding areas were hit in late December, with major flooding along the Mississippi. The preliminary combined precipitation amounts in Missouri for the November-December 2015 period were an unprecedented almost three times (over 15 inches) the normal amount.
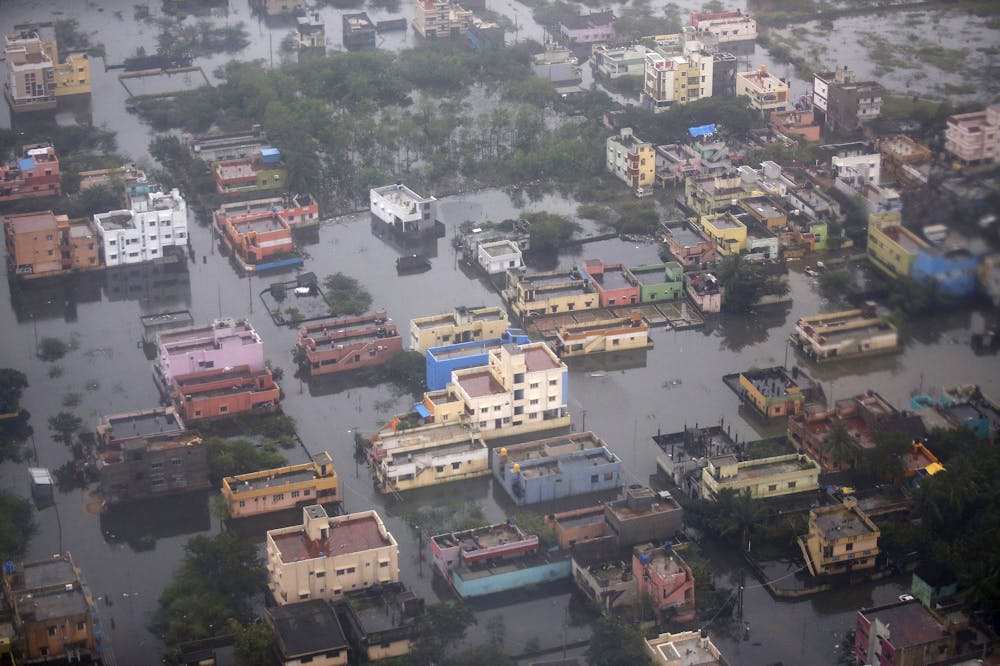
At the same time, central South America (especially Paraguay) was being hit with torrential rains and flooding. This mirror image between the two hemispheres – that is, flooding in both the north and south – is a characteristic of El Niño patterns. Major flooding also took place in Chennai and other parts of southeast India (in November and the first week of December) in association with exceptionally high sea temperatures in the Bay of Bengal.
On the other side of the coin, there have been major widespread droughts and wildfires in Indonesia, South Africa and Ethiopia. In the summer, major drought continued in California and along the West Coast from Alaska, western Canada, Washington and Oregon with record-breaking costs for fighting wildfires. It is the El Niño-related atmospheric patterns that determine what regions are favored for droughts while other regions are flood-prone.
Finally, far from a white Christmas, the eastern seaboard of the United States instead experienced unseasonably warm temperatures over 70°F.
What we have seen this past year will likely be routine in about 15 years, although regionally the details will vary considerably. Indeed, we have had a glimpse of the future under global warming.
It is yet a further reminder of the importance of the recent Paris Agreement that sets a framework for addressing climate change: slowing it down or stopping it and planning for the consequences.