
Our short series, the Science of Medical Imaging, examines the technology behind non-invasive methods of creating images of the human body. In this article, we discuss the technique of transmission imaging, in which the radiation source originates from outside the patient.
Since the first incarnation of the computed tomography (CT) scanner in 1975, devised by British engineer Godfrey Hounsfield (for which he was awarded the Nobel prize in 1979), the use of the technique has exploded.
In the US alone, approximately 70 million CT scans are performed annually.
So why are they so popular?
Compared to emission imaging - a useful technique for detecting whether a tumour is present - transmission imaging, such as CT, can show precisely where the tumour is located with respect to surrounding organs.
The best-known form of transmission imaging is the medical radiograph, commonly referred to as an X-ray, as it uses an X-ray generator as the source of photons to collect data on the medium that they pass through.
The science behind radiographs
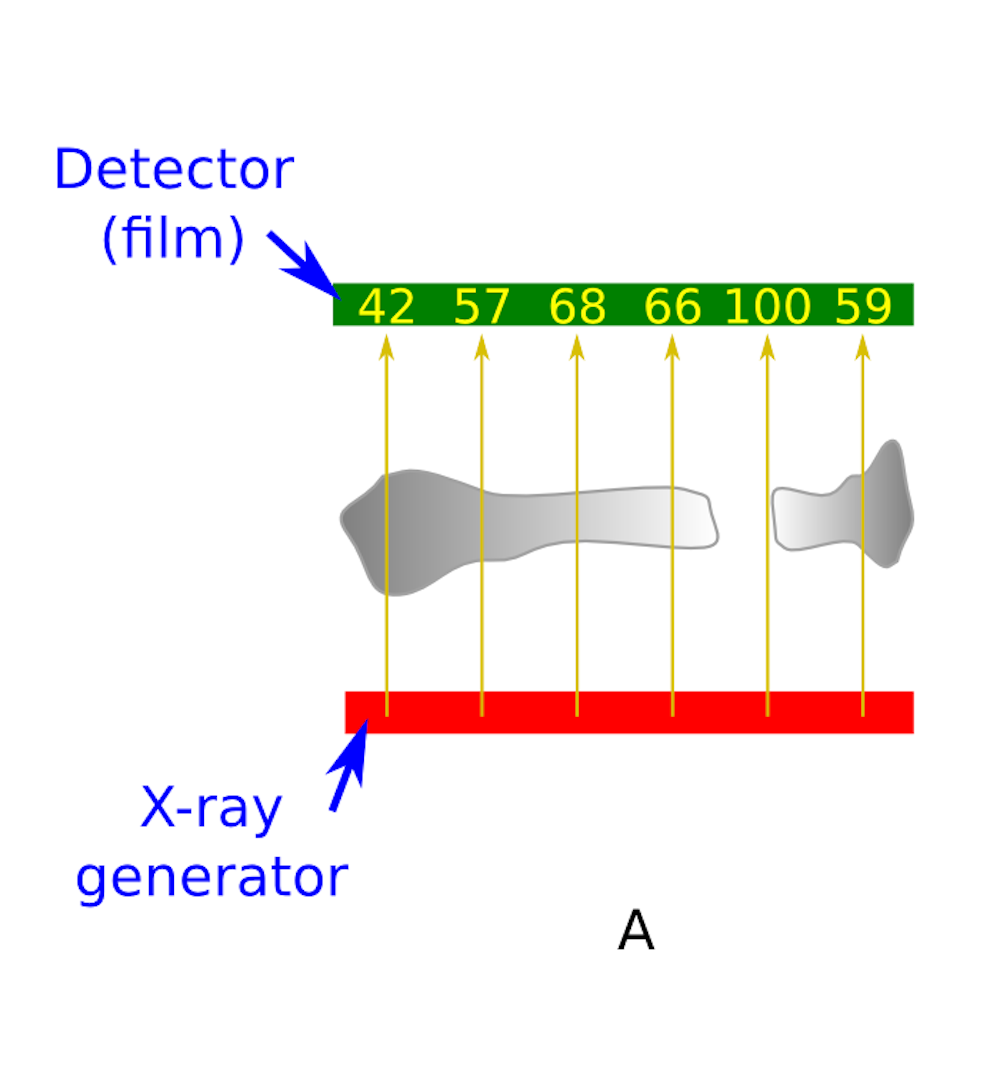
Figure A shows a simplified cartoon of a radiograph of a broken bone in 2D.
In the cartoon, the X-ray generator (source) is shown in red. The source produces 100 X-rays (yellow) at all six locations. The number of X-rays that reach the film (shown in the figure, left) is determined by the thickness of bone each X-ray beam (yellow arrow) intersects (assuming the bone is of uniform density).
The thicker the section of bone, the more electrons an X-ray encounters and the more likely it is the X-ray gets scattered or absorbed, and won’t reach the film.
The collective term for scattering and absorption is attenuation. Therefore, a thicker section of bone attenuates more of the incident X-rays giving a negative image of the bone on the film.
Each material has an attenuation coefficient. This is a number showing how many X-rays of a given energy would pass through a material of a given density and thickness.
In reality your bones are not uniform in density and are surrounded by muscle and tissue, all with varying densities. So the radiograph maps the average attenuation coefficient along the path of the X-ray beam.
As we all know, a traditional radiograph only gives you a single 2D projection. This works well for a broken arm, but in parts of the body where there are different organs in the way, the 2D image gives clinicians no sense of the depth perspective as all of the body parts in the scan appear to sit on top of each other.
Two to three dimensions
In order to obtain a more useful 3D image, clinicians have to take a series of 2D images (projections) at different angles and then perform a reconstruction step in software - known as CT.
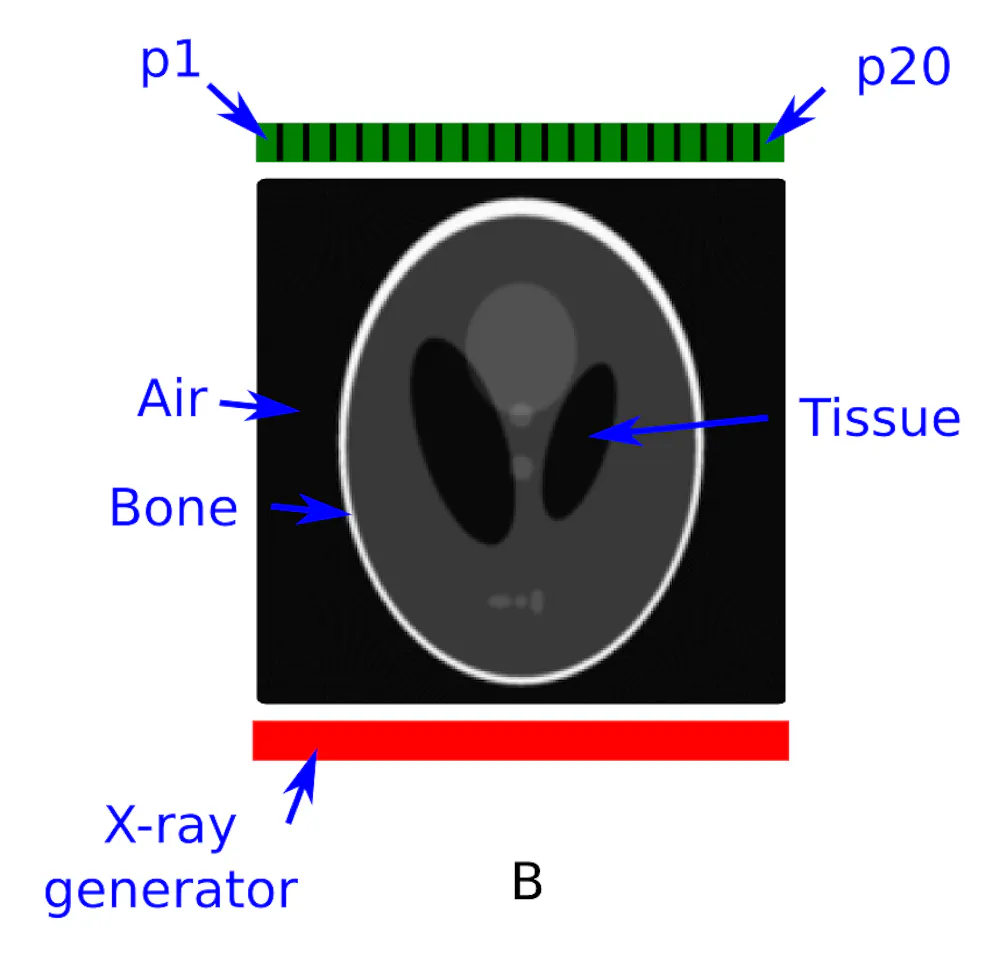
Figure B (above right) shows a cartoon of a CT scanner at its starting position with no rotation.
The detector (green) is divided into small pixels (p1 to p20) to record the number of X-ray interactions (intensity) at each pixel location.
Placed between the source and the detector is a cranial phantom called the Shepp-Logan Phantom. The word “phantom” refers to an industry standard representation that is agreed on by researchers so that they know they are comparing apples with apples.
The cranial phantom is in greyscale. The different colours of the components of the phantom are materials of different density, where white is the most dense and represents the skull.
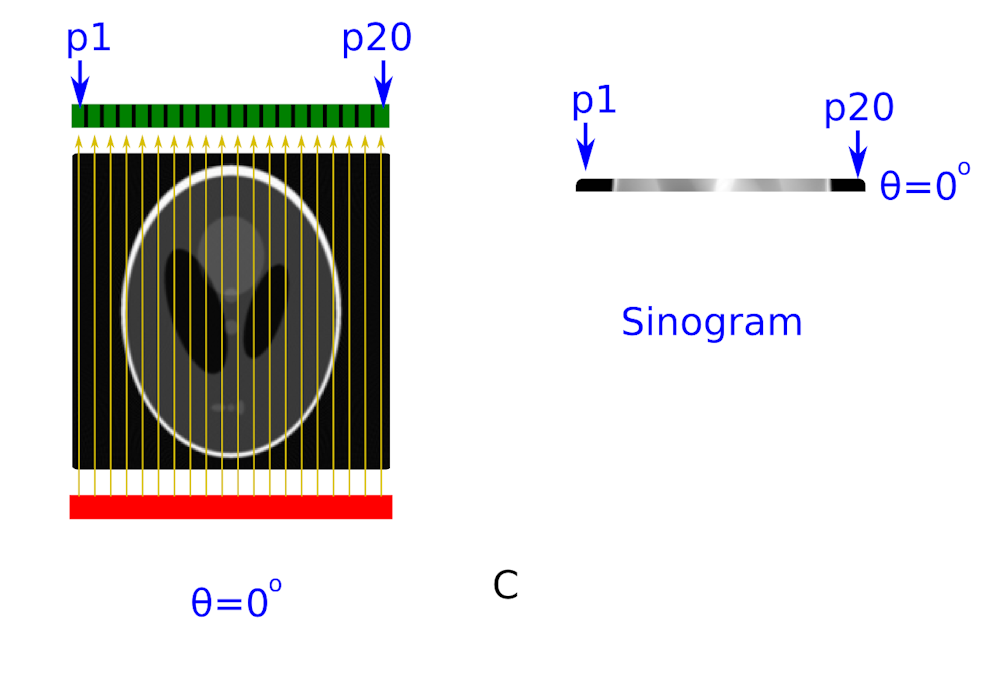
In Figure C, the source of X-rays has been turned on. The varying numbers of counts in each detector pixel are due to differing densities and thicknesses of material that each X-ray beam intersects.
Instead of writing the actual number of X-rays that each pixel will detect, the intensity is shown here as a horizontal strip of colour on the right side of the image. In this greyscale colour strip, black represents a high intensity (lots of X-rays passing through this particular section of the head) and white is low intensity.
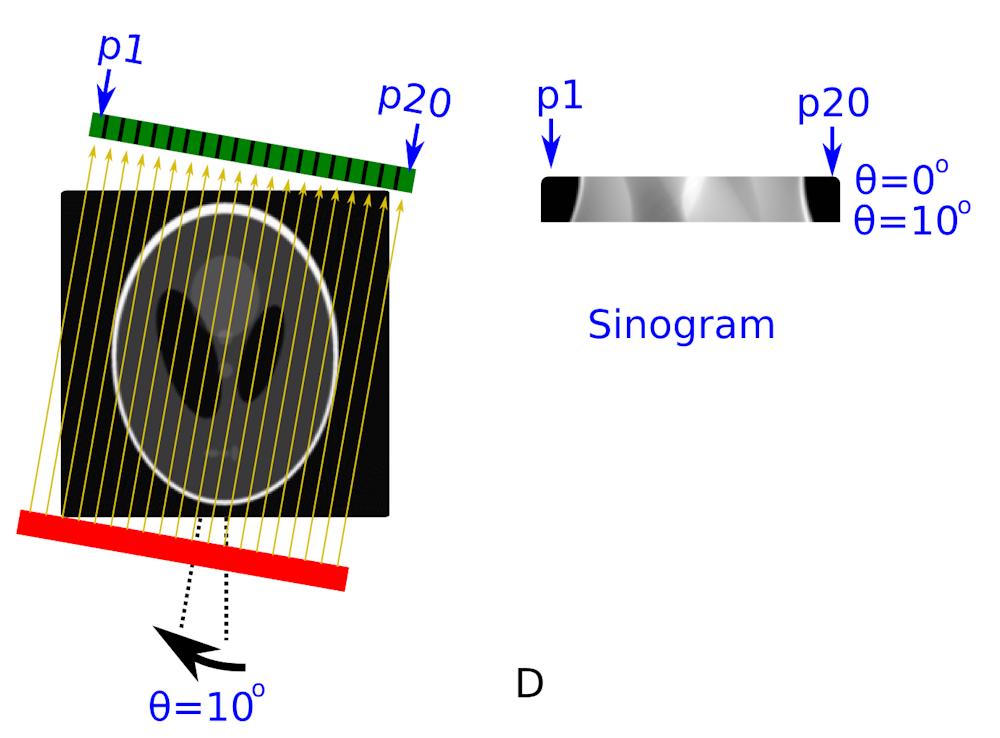
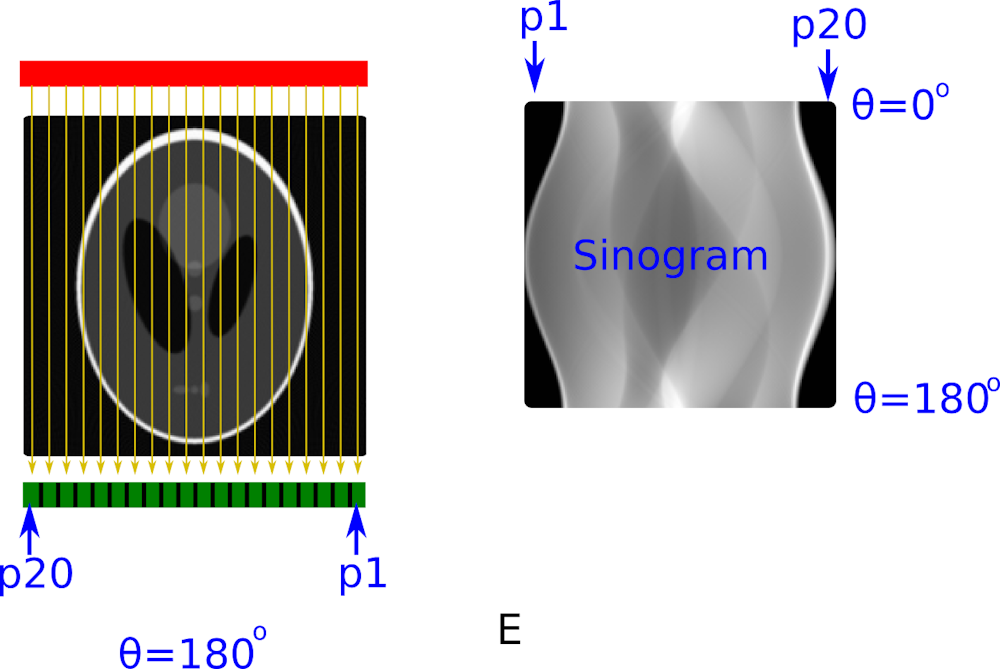
Figure D shows what happens when the source and detector is rotated around the patient by 10 degrees. The intensity detected in pixels p1 to p20 is now stacked below that from the 0 degree projection on the right hand side of the image.
Figure E shows what happens when the process of rotating by 10 degrees repeats, and the intensity measurements are recorded all the way around to 180 degrees.
The clinician ends up with an intensity image with pixel position along one axis and rotation angle along the other axis. This image is called a sinogram. Image reconstruction software analyses the sinogram to form an accurate anatomical representation of the patient’s skull.
Reconstruction
Getting from a sinogram to the image of what’s inside the patient is not trivial. The mathematics that unlocked this technique were first developed by the mathematician Johann Radon in 1917.
Modern implementations of image reconstruction that enable fast and accurate reconstruction are based on work published by Larry Shepp and Benjamin Logan (who have the phantom named after them) in 1974.
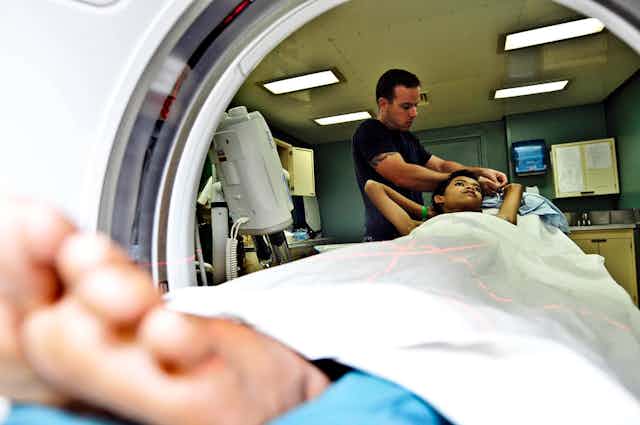
While CT scans have many benefits, the doctor must weigh up the pros and cons before prescribing it. On one hand, a CT scan provides essential detail that can aid diagnosis; on the other, radiation doses from CT are typically more than 100 times those from a conventional radiograph.
As such, the risk of inducing DNA damage that can lead to cancer must be properly assessed, especially in children.
Further reading:
SPECT and PET
MRI