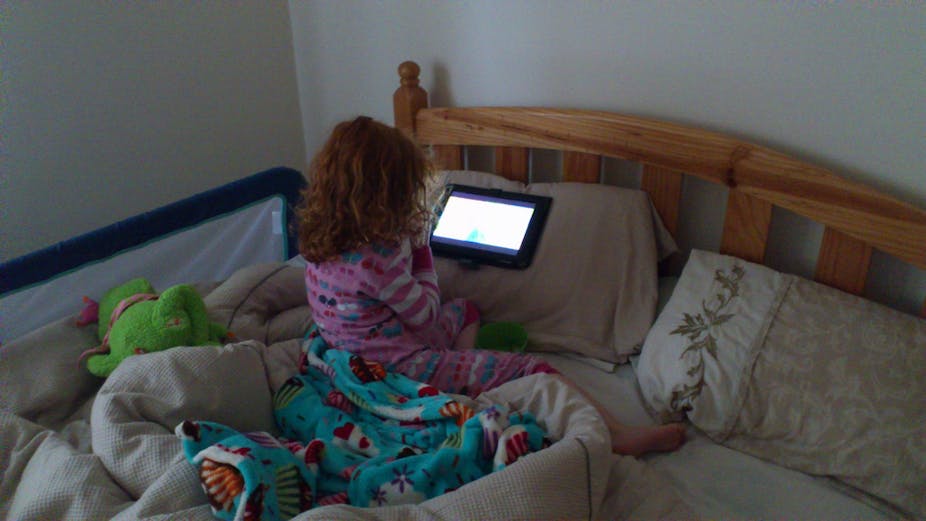
Having the numbers is a matter of life or death for both subscription and free-to-air commercial television broadcasters. So when it was revealed Oztam, the television ratings agency, would factor into the program ratings viewers using portable devices such as smart phones and tablets, it was a further sign that the viewing habits of the nation were changing.
And leading that change are shows like The Bachelor and Ja'mie: Private School Girl, whose demographic targets are big users of these devices.
Reliable data on non-conventional viewing practices will flow through to media buying practices and to advertising architecture. While time-shift viewing and the use of smart phones and tablets accounts only for a small fraction of viewership, small differences in ratings can account for large differences in a station’s asking price for commercial air time, its financial lifeblood.
The measurement of television rating relies on a sophisticated sampling of the Australian audience’s program choices every day of the year. The diary records of the 1960s and ‘70s, have been long replaced by electronic secretaries, of increasing complexity.
Sampling and generalisation
Ratings are a statistical construct based on sampling.
In a little over 5,000 carefully selected homes across Australia, small black boxes listen to the sound of each television set in use. In preparing the raw data for Oztam’s analysis, Neilsen TAM compare the sound samples with the sound logs submitted by each broadcaster to determine who was watching what. The fine detail is aggregated into 15 minute blocks for the published reports.
The 15 minute block gives a limited impression of audience behaviour.
Research done by Patricia Palmer while working for the ABC in the 1980s suggests that as the sample time is shortened, the audience’s reported behaviour becomes more erratic: they change channels more often, instigated perhaps by the arrival of ad breaks, or perhaps by restlessness and dissatisfaction with the program. A restless audience is not something broadcasters want to reveal to advertisers.
However, Palmer was working with children. Something else her work revealed was that children do not watch television as adults do. It is just one activity along with interaction with their peers, toys, food and their immediate environment: these days one expects, the Internet, too.
A model of Australia

Oztam and Neilsen have a statistical model about what Australia looks like. It is not a fixed model. Over time it has recognised the growth in the number of Australians born in Asia, and those that follow religions formerly less common, like Islam.
The sample households are selected to best replicate the characteristics of that model. Deficiencies in that model, or in the selection process, will diminish the validity of generalisations about who is watching what.
Households in the five mainland capital cities account for 3,035 of the sample while about 2,000 are in regional Australia and in Hobart, a slight the Tasmanian capital bears bravely. A further 1,200 households are surveyed for subscription-TV data. The ratings for each category is separately reported as they are each seen as separate markets.
Statistically speaking, an audience sample size of 1,067, properly selected, should yield a margin of error of plus or minus 3%, so a sample of 3,035 should yield a margin of error of a little more than 1% for the metropolitan audience. The error on the regional and pay-TV figure is significantly higher.
In some ways, modest errors in the data are not important. A winning program might get bragging rights at its premiere, but the rating’s trend line is more important. It indicates which way word of mouth is pointing. Finally, it’s water cooler talk that will have the say over station promos.
Ratings are measured in 10 blocks of four weeks each. Ten weeks including much of December, Christmas and the New Year and the two weeks either side of Easter are excluded. The exclusion of January must annoy Channel Seven because the Australian Open tennis coverage rates its socks off. However, it’s a chance to relentlessly showcase of their year’s programming to a captive audience.
Oztam ratings are always factoring in new technologies. First was subscription-TV. Then, a couple of years ago, time-shift viewing was included, divvied up as 'As Live’, same day viewing and ‘Time Shift’, viewing up to seven days after the original transmission.
The addition of on-line viewing offers new tools to target viewers with more demographic precision. On-line streams can deliver the commercial message more precisely than the free-to-air environment.
Be sure of this: such precision serves advertisers and broadcasters.
Finally, ratings are not a measure of excellence, but a measure of preference among limited program offerings. It is, frequently, a competition between the incomparable. It is a measure of mass taste rather than program excellence.
Sometimes, too, ratings remind us of how mindless we need part of the day to be, to survive the other realities of life.

