
Humans have caused a 10% reduction in the total numbers of land-based wild animal and plants over the past 500 years, according to a major new study. We’re also responsible for a 13% reduction in the number of species.
These are scary stats, but certainly more reassuring than last year’s Living Planet Index report which contained the jaw-dropping statistic that over the past 40 years the total number of wild animals on Earth has been reduced by half.
So, at first glance the new research published in the journal Nature appears to downgrade the impacts humans have had on other species. However, delving deeper into the article shows large regional differences and provides yet more evidence that we are on a collision course towards mass extinction by the end of this century.
Biodiversity is by its very nature difficult to measure. In order to determine how it changes over time, repeated measurements have to be made using the same methodology in the same region. Not straightforward in remote jungles, mountains or deserts. Consequently, data sets are often very hard to come by.
Cataloguing human impacts
A team of scientist led by Tim Newbold at the UN Environmental Program and Microsoft Research have solved this issue by integrating very large amounts of data collected as part of the PREDICTS project. In doing so, they have created a sort of time machine. That is, they trade differences over time for differences over space.
They make the assumption that the baseline biodiversity for a particular region is the pristine undisturbed state, prior to any human impacts.
They then compare biodiversity and abundance for similar regions that have experienced progressively more human impacts such as roads, size or urban areas, density of human populations and extent of forests and plantations.
They make the assumption that a region which is heavily affected by humans would have had the same biodiversity as today’s pristine example if they were able to go back far enough in time. They pick the year 1500 as a baseline with which to compare today’s biodiversity. This produces the figures of 10% reduction in the abundance (the total number of individuals of all species) and a 13% reduction in the number of plant and animal species over the past 500 years.
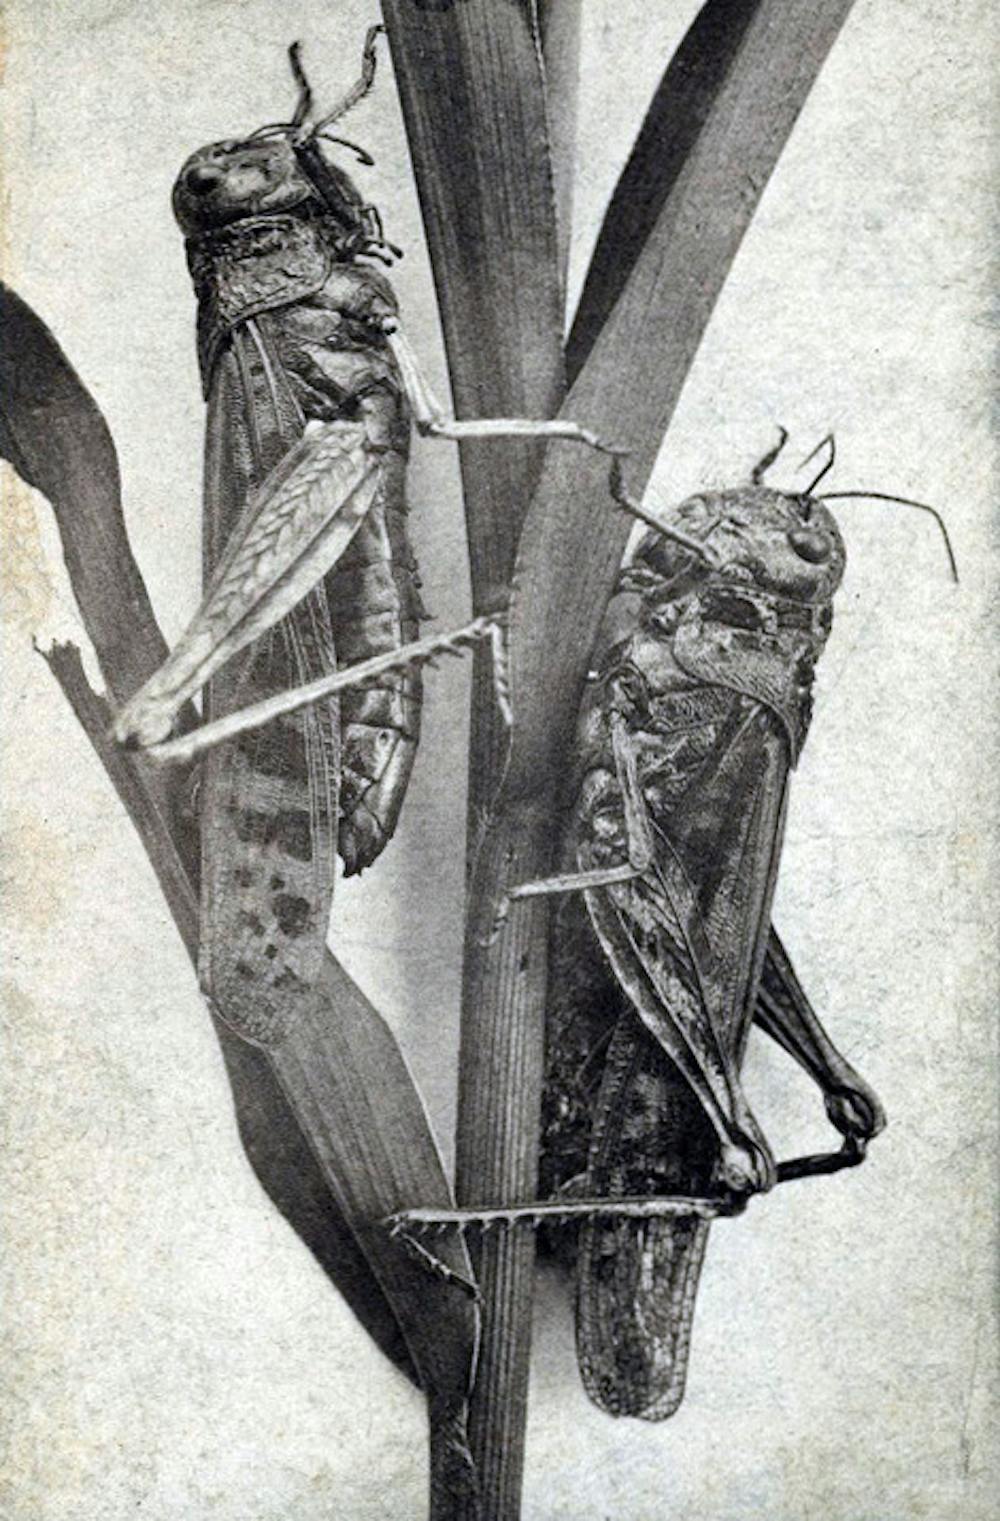
One of the reasons that this number may be significantly lower that the Living Planet Index, is that it considers a much wider range of species. The suspicion is that humans tend to focus their attention on a relatively small set of “interesting” species such as birds or mammals. The PREDICTS database contains info on 40,000 species of vertebrate, invertebrate and plant species that has been collected from 22,627 sites within 93 countries – it’s safe to say a dataset that large contains many mundane bugs.
Don’t blame the rainforests
The new study highlights very large regional differences. The worst affected areas have seen biodiversity collapse by more than 76% with a decrease of nearly 40% in abundance.
Where are these ecological disasters situated? Perhaps you image a rainforest ravaged by chainsaws, jagged tree stumps still smouldering even though the fire that was started to clear out the undergrowth vegetation long since burnt itself out. But the chances are that these biodiversity deserts are much closer to home. I for example need only look out the window.

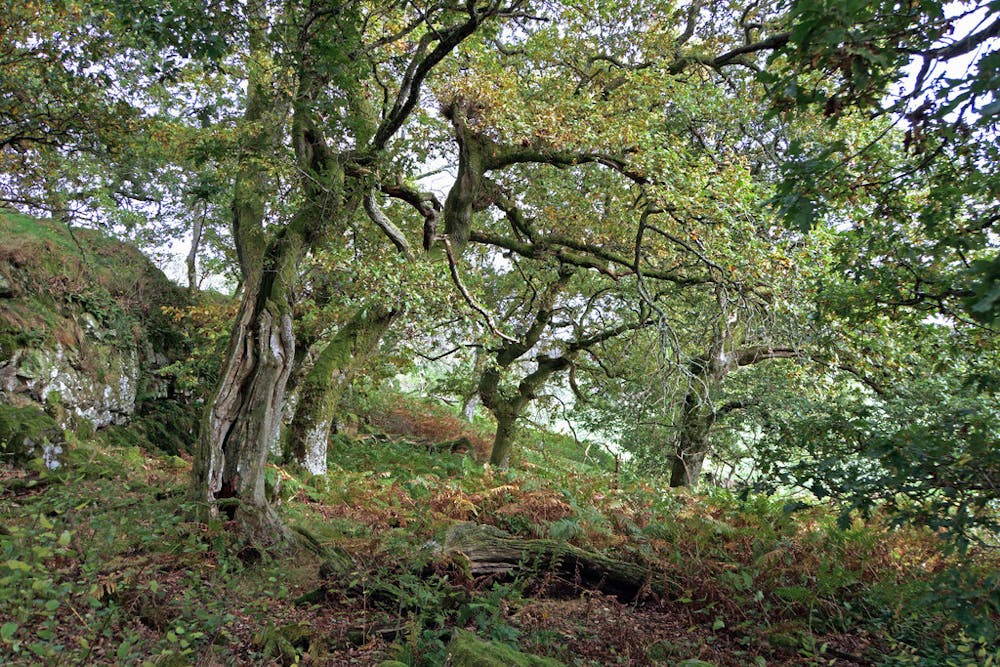
My office on the quite pleasant Highfield Campus at the University of Southampton is surrounded by trees, lawns and a little stream that bisects the grounds. It is all totally artificial. In pre-Neolithic times, woodland dominated most of the UK’s land surface. At least 99% of this ancient woodland has since been cut down, leaving the remaining small fragments dotted across the country.
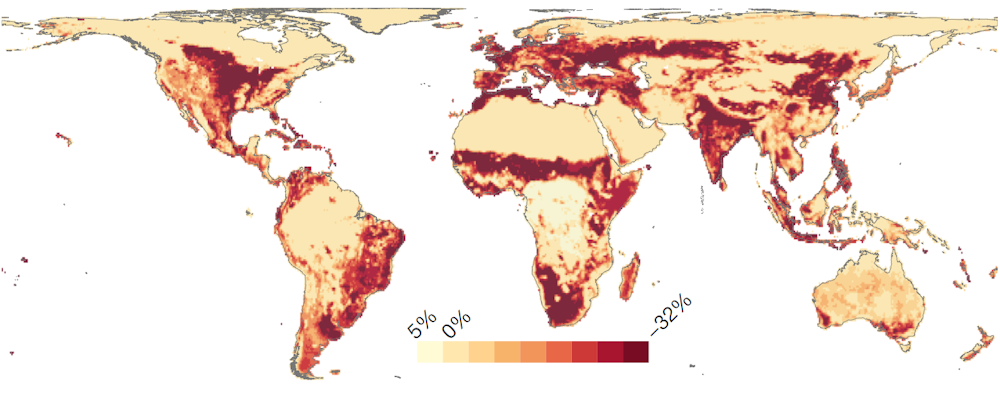
The map below shows this change. Significant regions of the British Isles are deep red which corresponds to biodiversity reductions of 32%. If you squint you may be able to discern less affected regions in northern Scotland and northern England. Most of the OECD or “developed” nations of Europe and North America are similarly shaded. While the process of deforestation is being reversed in many of these regions, this map shows just how far the impact of humans has reached.
Can mass extinction be averted?
That is what has happened in the past 500 years. What does the future hold? In order to answer that question, they assessed how things would change under different climate scenarios mapped out by the IPCC, known as Representative Concentration Pathways. There are four RCPs which paint a picture of different future worlds in which human impacts have changed in different ways. The worse case scenario, “MESSAGE 8.5”, sees CO2 emissions continuing to increase, passing 1,000 parts per million within 70 years from now (we are currently at 400ppm).
Perhaps unsurprisingly this scenarios sees the greatest decreases in biodiversity, as our global civilisation hurtles itself into dangerous climate change. But it’s important to point out that their assessment of biodiversity change did not include impacts from climate change itself. Instead, they used the RCPs to produce estimates for how land-use impacts would change over the next 100 years. MESSAGE 8.5 assumes continued increases in population, energy use, cities and agricultural areas to feed not only more mouths, but more middle class, meat and dairy eating mouths. All of which produces significant and sustained cuts into existing regions of high biodiversity.
The second-worst outcome for biodiversity actually turns out to be the second-best outcome for climate change mitigation. This is because the pathway, “MiniCAM 4.5”, assumes reductions in CO2 emissions as a consequence of large-scale use of biofuels. All those crops have to grow somewhere, which would require chopping down more pristine forests that have thus far escaped our impacts.
The ray of hope in this study is that it is possible to both reduce emissions and our impacts on biodiversity. The most optimistic pathway, “IMAGE 2.6”, sees CO2 emissions peak at 450ppm around the middle of this century and then return to the “safer” value of 370ppm by 2100. This not only slows down, but reverses the trend of decreasing biodiversity.
In that respect it is possible to have our cake and eat it: a decarbonising economy and recovery of biodiversity. Unfortunately all current indications are that humanity is closely following the trajectory of MESSAGE 8.5: eat as much cake as you possibly can and to hell with the consequences.