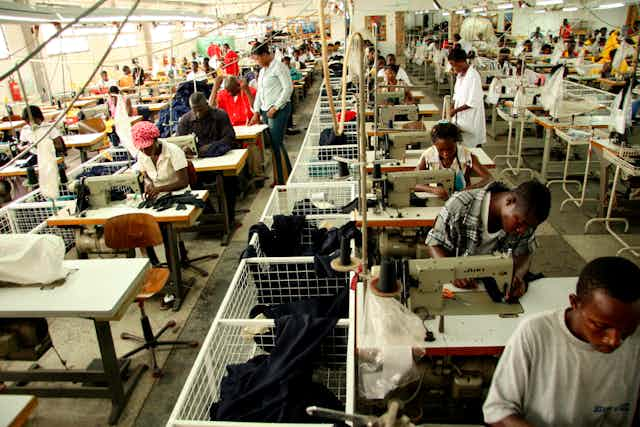
In the 1950s, Ghana was twice as rich as South Korea. By 2011, the most recent year for which data is available, South Korea’s income was more than ten times higher than Ghana’s.
Yet these differences in productivity between the overall economies of the two countries are modest compared with the differences that appear to exist in the productivity of their manufacturing firms. My colleague Simon Baptist and I set up such a comparison and were surprised by the size of these differences.
You could argue that rich countries simply have more resources so their companies are bound to be more productive – or have higher levels of output per worker. But my research suggests that this is not the answer.
The surveys covered the main sectors within manufacturing, textiles, garments, furniture, food and electrical goods. While the sectors are the same, clearly the type of firms within them will be very different across the two countries.
Median output – the amount of garments or furniture produced per employee – is nearly 20 times higher in South Korean manufacturing firms than in Ghanaian ones. Whereas in South Korea the median worker produces US$193,000 of output a year, the comparable number in Ghana is US$10,000.
If you look at this in terms of the value added to the products by the worker, the differences are even larger: the average Korean worker produces US$117,000 and a Ghanaian worker only US$3,000, nearly 40 times less in terms of added value. The Ghana data comes from a panel survey of the country’s manufacturing firms over the period from 1991 to 2003 and the South Korean data is for the period 1996-1998.
Making use of what you put in
In our search for the source of that difference, we identified three factors. First, the amount of capital the firms employ; second, the importance of education and, third, the differences in the underlying efficiency with which the firms operate.
This concept of underlying efficiency is sometimes called “total factor productivity” and can be thought of as how much more effective a firm is at using all of its inputs – such as its capital and labour – than other firms. Most economists think differences in underlying efficiency are the most important reason for the large differences we see across countries and also across firms.
At first sight that also appears to be the case in our comparison of Ghanaian and Korean firms. In the first graph below, the vertical axis shows output per labour hour and the horizontal axis, capital per labour hour. The key point in the figure is the distance between the two lines, which measures the average differences in the efficiency with which firms in the two countries use capital and labour.

While there is some overlap, showing that some Ghanaian firms are as efficient as Korean ones, on average the differences are large. The chart implies that, on average, Korean firms produce six times more output with the same capital and labour as Ghanaian ones. That is one measure of underlying productivity.
The importance of education
Yet, the chart omits the possible role of education. When we included education in our analysis we find that its impact on output was massively larger in Korea than in Ghana.
The second graph below shows how education affects output per labour hour: the green line shows the effect for South Korea, the blue line the effect for Ghana. Most firms employ a workforce that have had on average between five and 15 years of education. Over this range, output per labour hour in South Korea increases dramatically; but for Ghana it scarcely changes.

This analysis implies that all the differences in productivity across the two countries can be explained by how much more effective education is at increasing output in South Korea than it is in Ghana.
It is very hard to show whether these changes in education actually cause the differences seen in the chart. But it is clear that something associated with education is having very different effects in the two countries.

Several possible explanations suggest themselves. The first and most obvious is that the quality of education differs across the countries. A second possibility is that human and physical capital are being combined in fundamentally different ways in the two countries.
Take a simple example: a machine operator in South Korea operating a robot to produce garments may have the same number of years education as a machine operator in Ghana operating an electrical sewing machine. Even allowing for the substantial differences in capital – between a high-tech robot and a sewing machine – it is still very possible that one can be five times as productive as the other.
A third possibility is that the quality of the management is the key difference. Recent research, provides some evidence that poor management may explain low productivity within firms, although further research is needed to explain how management is linked to the uses made of educated labour.
Taken together these explanations imply that while the quality of education makes a massive difference to manufacturing output in South Korea, it would be a mistake to think that investing in education alone is the answer to increasing productivity. It’s important to also consider the quality of that education, the technology the firms are able to employ cost-effectively, and the quality of the management.

