

Where does your T-shirt come from? It’s a question that apparently can be answered with an awkward neck twist and a glance at the label. But the real answer is way more complex.
Even producing a single T-shirt relies on coordinating an array of interconnected supply chains, usually spanning multiple nations. This globalised system is a marvel of human ingenuity and logistics.
But it also can obscure the true carbon emissions of the products we use, raising serious questions about their sustainability. And it enables wealthier countries to effectively outsource their emissions to less wealthy ones via “carbon colonialism”.
Let’s say your T-shirt’s label reads: “Cambodia”. It’s fair to assume that this clearly indicates its origin. But that’s not the whole story.
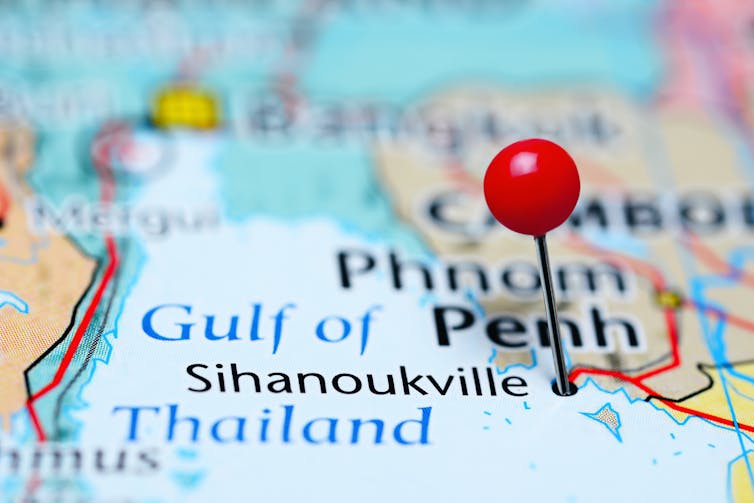
Cambodia exports 40,000 tonnes of garments to the UK annually (4% of British clothing), and most depart from the port of Sihanoukville. At 18,244km from the UK’s main shipping port, Felixstowe, that’s a huge distance for your T-shirt to travel. But as colleagues and I revealed in our recent research, this is only the final leg of an even longer journey.
The Chinese connection
Unlike other garment exporters, such as Bangladesh or Vietnam, Cambodia doesn’t grow cotton. Nor does it spin cotton, or manufacture artificial fibres. Instead, Cambodian factories import textiles from abroad, often only providing the finishing touches to partly completed garments. So, although your garment may say it’s from “Cambodia”, the textiles probably came from further afield – much further.
Between 2015 and 2019, 89,721 tonnes out of the total 161,455 tonnes of garments that the UK imported from Cambodia can be indirectly linked to cotton products, knitted fabrics and artificial fibres supplied to Cambodia by China. And most of China’s garment industry is located in the coastal provinces of Jiangsu, Zhejiang, Guangdong and Hubei – roughly 2,500km to 6,000km from Cambodia.
But the process stretches further still. 84% of China’s domestic cotton production occurs in the far western province of Xinjiang. This means the raw cotton processed in China’s coastal factories must first travel between 3,000km and 4,300km by rail from Xinjiang: roughly the distance between London and Lagos.
Read more: Sustainable fashion expert: why I'm cutting my wardrobe down to ten items this month
So even before your T-shirt labelled “Cambodia” arrives in Cambodia, the raw materials have travelled between 5,500 and 10,300km, by sea and rail. This adds a huge hidden carbon cost to the final garment.
And yet there is even more to the story. China is the largest cotton grower globally, producing over 25% of the world’s total crop. But it is also the world’s premier apparel manufacturer, and demand considerably outstrips supply. China produced 6.07 million tonnes of raw cotton in 2018-19, but consumed 8.95 million tonnes, leaving a massive shortfall.
China compensates for this shortfall with imports. Most – 88% of the total – come from Australia, US, Uzbekistan, India and Brazil. The distances travelled by these imports vary – from about 1,350km (between Tashkent, Uzbekistan and Xinjiang, China) to a maximum of 35,700km (between Los Angeles, US and Shanghai, China, if via Panama and Suez).
So the Cambodia label on that T-shirt marks just one stop along a vast global journey. Indeed, before you bought it in the UK, the T-shirt – and the raw materials behind it – probably travelled between 25,000km and a whopping 64,000km (over-one-and-a-half times the Earth’s circumference).
A long way round
A supply chain of this length is alarming. But the broader implications are starker still.
A typical T-shirt is expected to produce 6.75kg of carbon during its production and sale. A product’s carbon footprint is often estimated by adding up the carbon generated during the entire production process. This includes, for example, the growth of the cotton, its processing into textiles, its manufacture into clothing, transport, retail, usage, and disposal.
And when a country imports a product, all of these emissions are added to its imported, or embodied, carbon footprint. Since the processes involved are so complex and varied, however, we tend to use average figures for a given part of the production process, rather than empirically measuring the entire supply chain.
But this system fails to take into account the vast “hidden” distances our example T-shirt – and the raw materials behind it – travelled. At 25,000km, where the cotton comes exclusively from western China, the transportation of that single Cambodia branded T-shirt would likely emit 47g of C02. This is 7.1% of the carbon emitted during its entire production and 50% more than the estimates used by sustainability advocacy groups such as the Carbon Trust.
At 64,000km, where the cotton originates from the US or Brazil, the T-shirt will generate 103g of CO₂ on its journey around the world. That’s over 15% of the total emissions generated during its production and more than triple the average value on which carbon footprints are calculated.

These errors may not seem like much on a single T-shirt. But they make a huge difference when scaled up to cover the entire UK-Cambodia apparel trade. Those 40,000 tonnes of clothing imported to the UK from Cambodia each year would be generally estimated to produce 8,304 tonnes of CO₂. Yet the true figure, taking into account the hidden distances travelled by the raw materials, is between 13,400 tonnes and 28,770 tonnes. That’s up to 20,466 tonnes unaccounted for: the equivalent of 4,422 cars being driven for a year.
Now imagine these numbers scaled up to truly reflect every product sold globally.
Invisible systems
Figures like these illuminate the otherwise invisible systems underlying our everyday lives, casting doubt on many of the assumptions we make about sustainability. Indeed, the lack of transparency surrounding global supply chains means that many sources of emissions are either hidden or significantly underestimated. And their extraordinary complexity impedes detailed analysis and undermines accountability, concealing many carbon emissions from public view.
This ability to “hide” emissions in complex global production processes has been called a “carbon loophole” or even “carbon colonialism” as it allows major importing economies to move carbon intensive production processes out of their headline domestic emissions statistics and onto those of other countries, often with less capacity to measure the full extent of these impacts.
And there is now growing recognition that these problems may lie at the root of our more general failure to cut carbon emissions. In total, imported emissions now account for a quarter of global CO₂ emissions – and addressing this should be seen as the next “frontier of climate policy”.
The single country origin label sewn into your T-shirt is an illusion, reflecting a problem that affects so many of the items we purchase and use daily. In fact, that country of origin is just one stop on a global journey of assembly that is anathema to truly sustainable production and a key obstacle in our fight against the climate crisis.
A better understanding of this hidden geography is the first step towards tackling the opaque and misunderstood carbon footprints of our global economy – and decolonising systems of environmental accounting that favour the world’s biggest polluters.
This article was updated to amend details of the distance travelled between Los Angeles and Shanghai.

Don’t have time to read about climate change as much as you’d like?
Get a weekly roundup in your inbox instead. Every Wednesday, The Conversation’s environment editor writes Imagine, a short email that goes a little deeper into just one climate issue. Join the 10,000+ readers who’ve subscribed so far.