

Despite a long history of research into poverty, no consensus yet exists on what constitutes being “poor” or “disadvantaged”. Measures of household wealth don’t go far enough in identifying those most at risk of being excluded from society. Nor do such measures explain the level of exclusion they face.
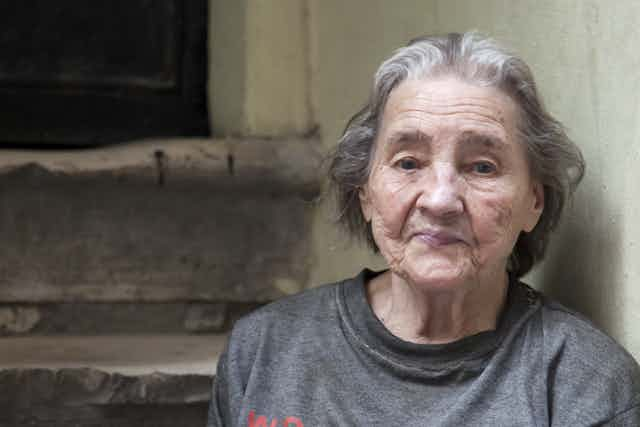
Significant numbers of people are at risk, however. Our research suggests that more than one in two people with a disability or long-term health condition and nearly half of people aged 65 and above experienced social exclusion in 2012.
A better way to measure poverty?
Monitoring changes in the prevalence and characteristics of poverty is crucial to keeping track of whether a society is really successful in tackling this problem. Traditional measurements have too narrowly focused on incomes and whether households can afford a minimum acceptable standard of living.
Broader concepts have emerged more recently. These recognise that socioeconomic disadvantage is much more complex. One more useful method is the concept of “social exclusion”.
The measure, which first emerged in Europe, encompasses not only income and other economic resources, but also dimensions of disadvantage – such as health and education – that determine individuals’ ability to participate fully in society.
The Social Exclusion Monitor, developed by the Brotherhood of St Laurence and the University of Melbourne, has proven useful in Australia to measure the extent and evolution of a wider notion of poverty and disadvantage.
In contrast with income-based poverty measures, the monitor measures the accumulation of deprivation across seven life domains: material resources, employment, education and skills, health and disability, social connection, community and personal safety.
Considering a total of 29 indicators across these domains, it uses data from the national Household, Income and Labour Dynamics in Australia (HILDA) survey. Since 2001, this survey has annually collected detailed socioeconomic data for a nationally representative sample of the population. This allows the monitor to study social exclusion since the beginning of the 21st century.
The latest issue of the Social Exclusion Monitor bulletin, written by researchers Francisco Azpitarte and Dina Bowman, provides revealing insights into the nature and characteristics of disadvantage.
For 2012, the most recent wave of HILDA data, around 25% of Australians aged 15 years or above experienced some level of social exclusion: 20% were marginally excluded, 5% deeply excluded and almost 1% very deeply excluded.
This means that about 825,000 Australians experienced deep exclusion and more than 150,000 people were very deeply excluded.
Social exclusion worse for some
The monitor also provides valuable insights into trends over time. Overall, the impact of the 2008 global financial crisis was more limited in Australia than in many countries, but it marked a turning point in terms of social exclusion.
From 2001, the prevalence of exclusion steadily declined to reach a low point for the period in 2008. The decline in unemployment and the rate of jobless households, measured by the monitor’s employment domain as well as the fall in the proportion of people with a low level of education, contributed to the reduction in the number of excluded.
However, following the global financial crisis, the prevalence of marginal exclusion started to grow. It has remained above pre-crisis levels since then.
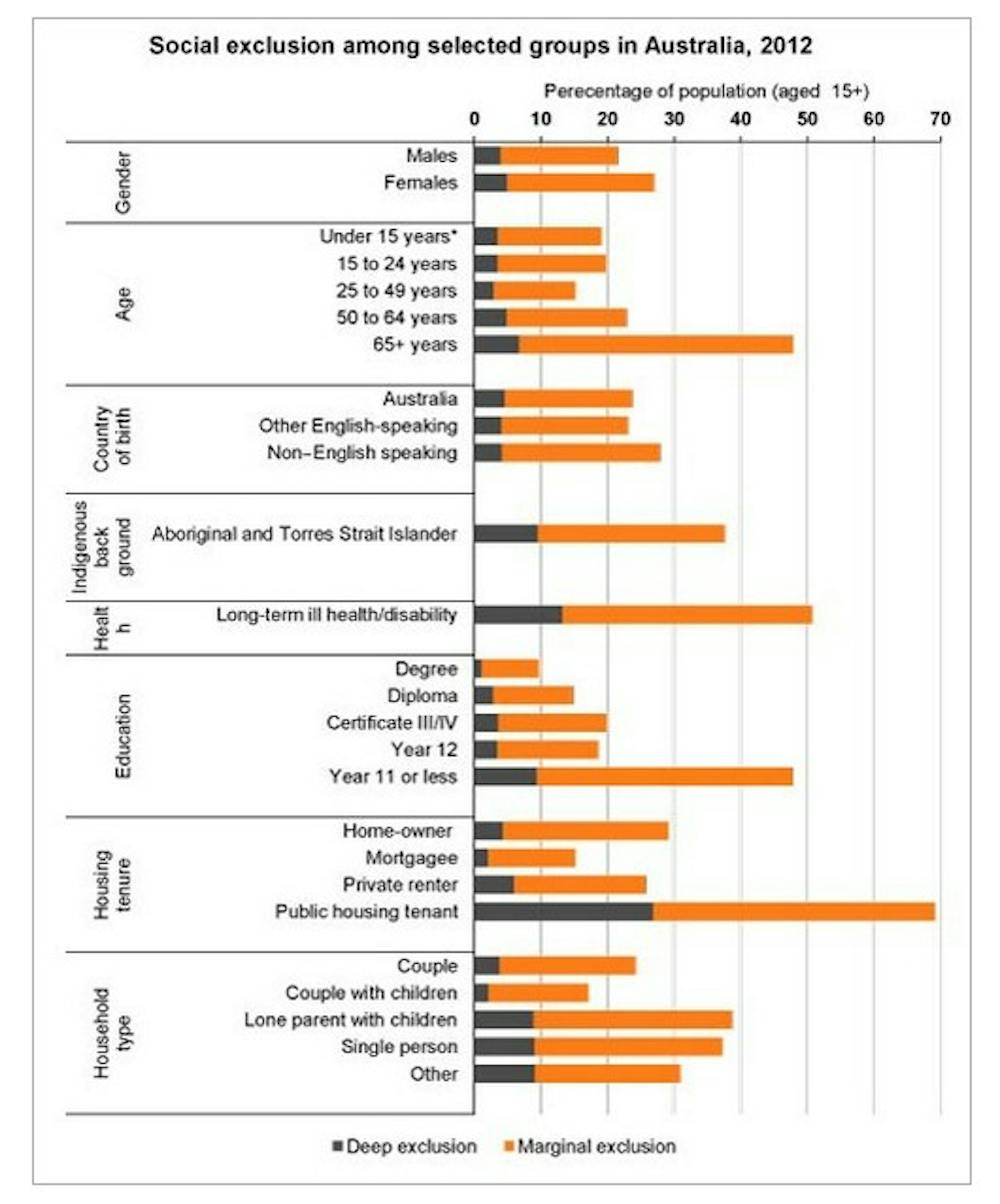
The Social Exclusion Monitor bulletin shows the risk of social exclusion is not the same for everybody. The demographic groups most likely to experience exclusion are people aged 65 and above – almost half experienced it in 2012 – and people with long-term health conditions or a disability – more than half experienced it.
The risk of exclusion also varies with the level of education. The prevalence of social exclusion among those with less than Year 12 is more than 2.5 times higher than among those with more education.
The type of households individuals live in also influences the risk of exclusion. Single parents and people living alone experience exclusion at higher rates than other families. Public housing tenants have higher rates of exclusion than those in other forms of housing.

There is also a gender gap. Women are more excluded than men in all age groups, overall by more than five percentage points. The difference is larger among people aged over 55.
The most prevalent indicators of exclusion are low education, long-term health conditions or disabilities and low wealth – each is experienced by at least 20% of people. These are the key to understanding social exclusion in Australia.
The sources of exclusion do vary over the life cycle, however. Education and employment are the main drivers of exclusion for those under 25, accounting for more than half of the exclusion of this age group. In contrast, economic resources, health and community engagement make the largest contribution to the exclusion of people aged 65 and above.
Unsurprisingly, some socioeconomic groups are more likely to experience persistent social exclusion than others. Analysis of the longitudinal information in the HILDA survey shows that older Australians, people living in highly disadvantaged areas as measured by the Socioeconomic Indexes for Areas, long-term unemployed and households with members who are jobless or have a disability are more likely to experience persistent exclusion.
The reason is twofold. People in these groups are both less likely to move out of poverty and, if they have managed to improve their circumstances, more likely to fall back into it.
This data reveals few surprises. The findings tell a familiar and consistent story about who is and isn’t excluded in Australia. However, the analysis of the sources of exclusion at different points in the life cycle and the findings in relation to persistent exclusion are especially important for developing polices to reduce social exclusion.

These findings underline the need to focus our policies and services on the places and groups where social exclusion is concentrated. We need to redouble our efforts to keep young people in education while also assisting them, and the long-term jobless, to find and retain employment.
We must ensure that older people with chronic health conditions and those with a disability are able to participate in the community while also addressing their health needs.
And if we were really smart we would invest in early intervention among these groups to prevent persistent social exclusion.