


“Mr Rudd can stand up and show us his chart and demonstrate that by comparison with some other countries, Australia’s debt and deficit position is not so bad. But it’s not what we’ve done, it’s where we’ve started that makes the difference and this is where Mr Rudd’s deterioration in the fiscal position has been on a scale to match the disasters of Europe.” - Opposition leader Tony Abbott, press conference, 4 August.
Firstly, it’s clear the Prime Minister’s charts comparing Australia’s debt and deficit with other developed countries – like the ones he showed at the National Press Club last month – generally show that our position is not so bad. According to the Organisation for Economic Co-operation and Development (OECD), the ratio of gross public debt to Gross Domestic Product in Australia was 32.4% in 2012, compared with the OECD average debt level of 108.8%.
In 2011, eight countries had a public debt ratio above 100%. The only countries with a lower debt to GDP ratio were Estonia and Luxembourg. Gross public debt represents the current stock of debt owed by the government, and the ratio of this debt to GDP reflects the size of this debt to a country’s income. As with an individual, if the debt to income level becomes too high then the country eventually will get into difficulty, as has been the case with Greece in recent years.
On the annual deficits Australia’s position is also strong. The 2012 government deficit was 3.3% of GDP, compared with an OECD average of 5.7%. Both Spain and Greece had a deficit greater than 10% of GDP, while the US deficit was 8.7% of GDP.
But Mr Abbott’s statement comes down to the question of how these variables have moved in the past six or seven years. Figure 1 presents the increase in the deficit to GDP ratio between 2007 and 2013 for thirty countries in the OECD. In Australia in 2007 the budget was in surplus, with the surplus equal to 1.8% of GDP. It is interesting that during that year fifteen of the thirty OECD economies were running budget surpluses.
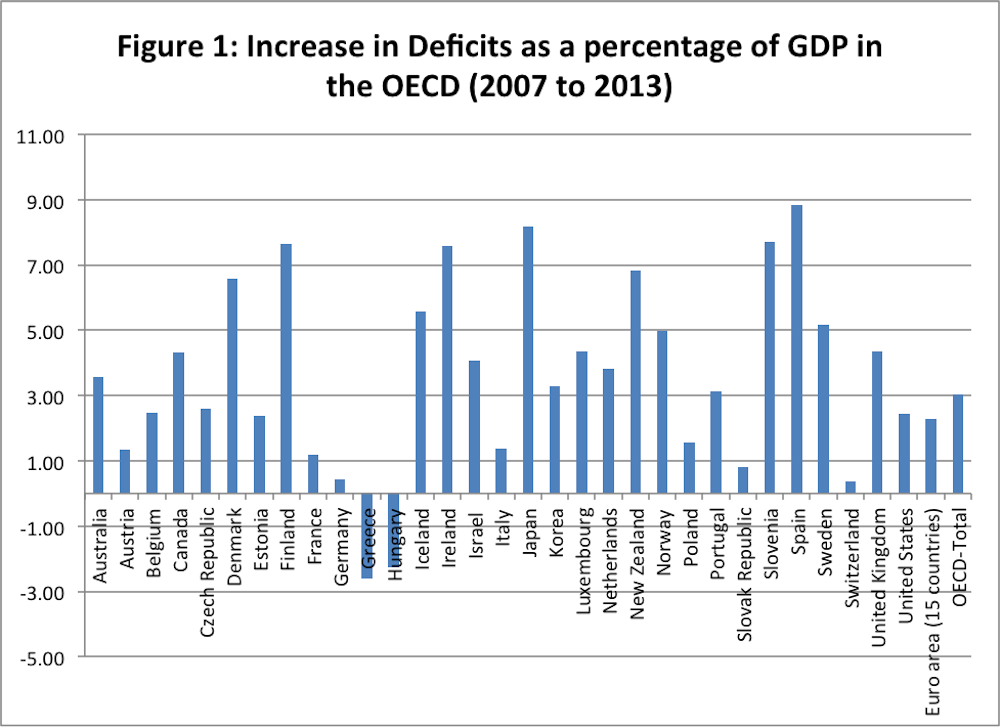
Since 2007, the Australian budget position has deteriorated by 3.6% of GDP. Fifteen countries in the OECD have had a smaller deterioration in their starting position since 2007. Interestingly, Figure 1 shows that with regard to deficits, evidence to support Abbott’s statement is mixed. The deterioration in the deficit to GDP ratio has been much worse in Spain and Ireland; however in many other European countries the deficit to GDP ratio has moved less than in Australia. It is notable that the deficit to GDP ratio has actually improved in Greece and Hungary, though this shows the poor state of public finances in those countries in 2007 as much as anything else.
Moving on to public debt, Figure 2 shows that the public debt position in Australia has increased by 19.1% of GDP since 2007. Within the OECD ten countries have seen smaller increases in their public debt ratios since 2007. If we go back to 2007 Australia’s public debt to GDP ratio was 14.6%, compared with an OECD average debt ratio of 74.3%.

Within the OECD at that time, only Estonia and Luxembourg had lower debt to GDP ratios. Notably, the increase in the public debt ratio in the PIGS (Portugal, Ireland, Greece and Spain) has been greater than 50%. Quite clearly in this case the deterioration in our debt position has been nowhere near as bad as in the “disasters of Europe” though once again Mr Abbott’s point that we started from a much better position is correct.
Verdict
Tony Abbott’s statement is mostly false. While it is correct that Australia’s starting position was stronger than almost all countries with regard to public debt in 2007, the deterioration in that debt has been nowhere near the scale of “the disasters of Europe”.
Similarly, the picture with regard to the deterioration in our annual budget position is mixed with compared with European countries, or other countries in the OECD. There is plenty to complain about with regard to fiscal management in the past decade, but we can be thankful that we’re not in Greece!
Review
The article presents a balanced assessment of the opposition leader’s claim. It seems reasonable to interpret the “disasters of Europe” as including Portugal, Ireland, Greece and Spain (PIGS), and it is also useful to provide a comparison to other OECD countries. Since 2007, the increase in gross debt as a percentage of GDP for Australia has been substantially less than for the PIGS.
You get a similar picture when you look at net public debt.
When the budget deficit as a percentage of GDP is used, both Ireland and Spain have experienced significantly larger increases in this variable than Australia. However for Portugal the increase in the deficit to GDP ratio is of a similar magnitude to the increase for Australia, while Greece has actually experienced a decline.
This evidence for the latter two countries is therefore not inconsistent with the opposition leader’s claim. Of course, what the results for Greece suggest is that changes in the budget deficit are only one indicator of the overall performance of an economy. - Glenn Otto.