
Ocean life is largely hidden from view. Monitoring what lives where is costly – typically requiring big boats, big nets, skilled personnel and plenty of time. An emerging technology using what’s called environmental DNA gets around some of those limitations, providing a quick, affordable way to figure out what’s present beneath the water’s surface.
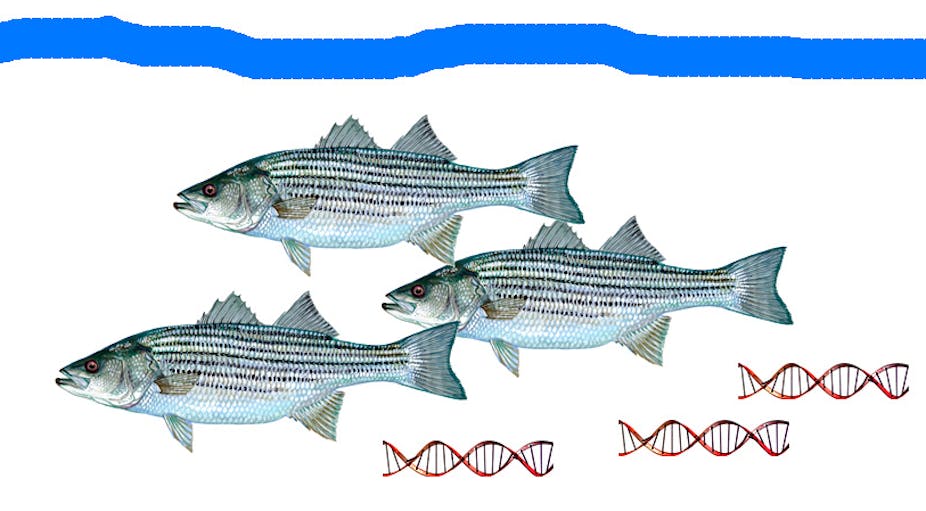
Fish and other animals shed DNA into the water, in the form of cells, secretions or excreta. About 10 years ago, researchers in Europe first demonstrated that small volumes of pond water contained enough free-floating DNA to detect resident animals.
Researchers have subsequently looked for aquatic eDNA in multiple freshwater systems, and more recently in vastly larger and more complex marine environments. While the principle of aquatic eDNA is well-established, we’re just beginning to explore its potential for detecting fish and their abundance in particular marine settings. The technology promises many practical and scientific applications, from helping set sustainable fish quotas and evaluating protections for endangered species to assessing the impacts of offshore wind farms.
Who’s in the Hudson, when?
In our new study, my colleagues and I tested how well aquatic eDNA could detect fish in the Hudson River estuary surrounding New York City. Despite being the most heavily urbanized estuary in North America, water quality has improved dramatically over the past decades, and the estuary has partly recovered its role as essential habitat for many fish species. The improved health of local waters is highlighted by the now regular fall appearance of humpback whales feeding on large schools of Atlantic menhaden at the borders of New York harbor, within site of the Empire State Building.

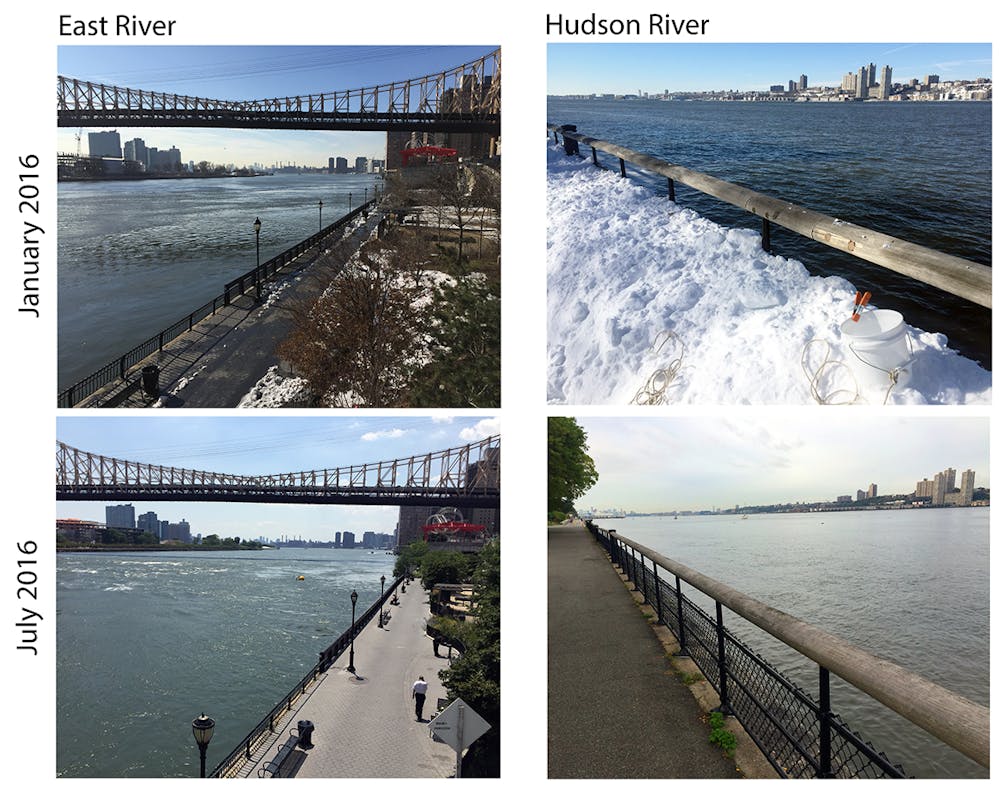
Our study is the first recording of spring migration of ocean fish by conducting DNA tests on water samples. We collected one liter (about a quart) water samples weekly at two city sites from January to July 2016. Because the Manhattan shoreline is armored and elevated, we tossed a bucket on a rope into the water. Wintertime samples had little or no fish eDNA. Beginning in April there was a steady increase in fish detected, with about 10 to 15 species per sample by early summer. The eDNA findings largely matched our existing knowledge of fish movements, hard won from decades of traditional seining surveys.
Our results demonstrate the “Goldilocks” quality of aquatic eDNA – it seems to last just the right amount of time to be useful. If it disappeared too quickly, we wouldn’t be able to detect it. If it lasted for too long, we wouldn’t detect seasonal differences and would likely find DNAs of many freshwater and open ocean species as well as those of local estuary fish. Research suggests DNA decays over hours to days, depending on temperature, currents and so on.
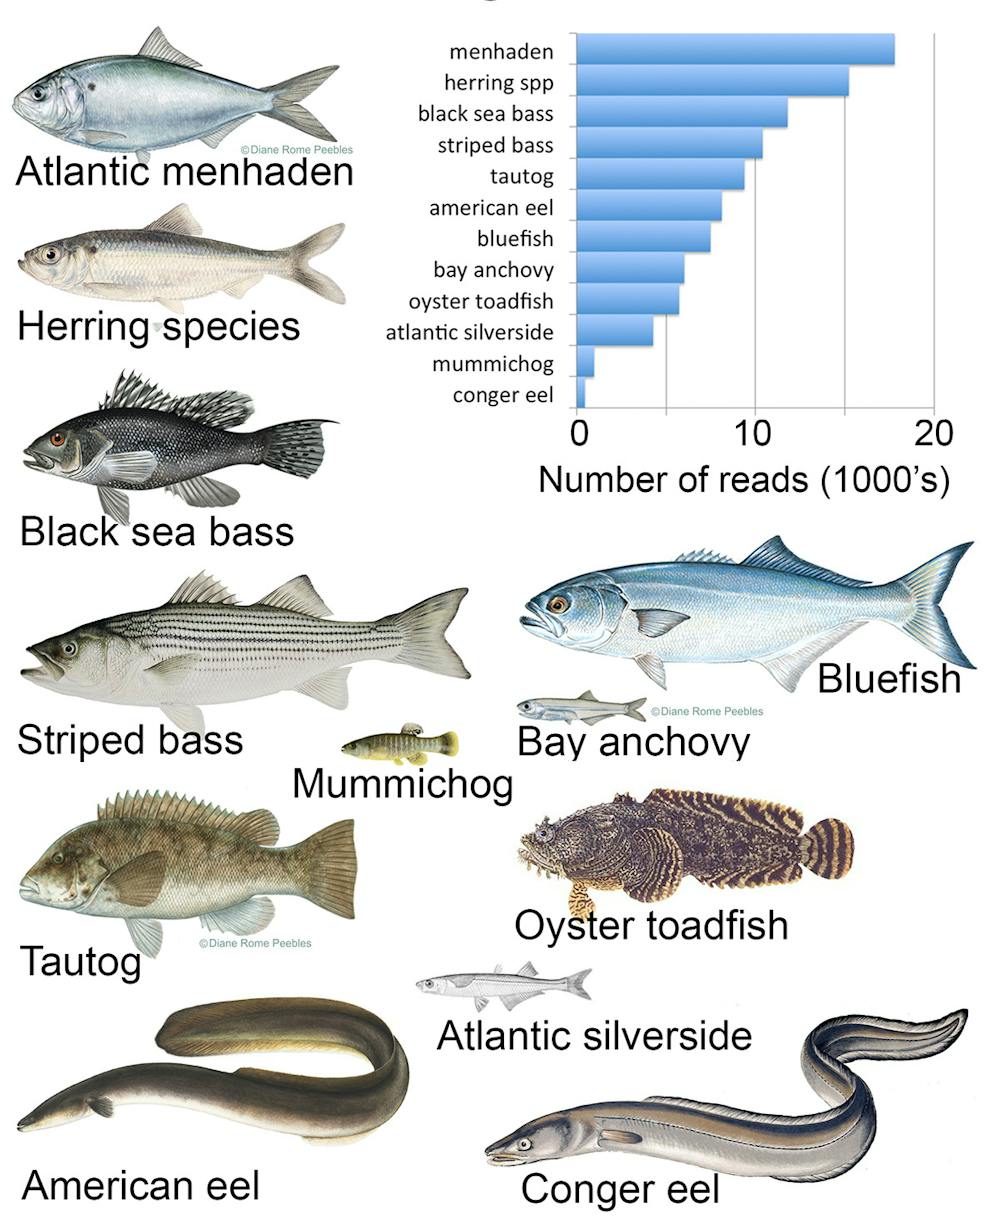
Altogether, we obtained eDNAs matching 42 local marine fish species, including most (80 percent) of the locally abundant or common species. In addition, of species that we detected, abundant or common species were more frequently observed than were locally uncommon ones. That the species eDNA detected matched traditional observations of locally common fish in terms of abundance is good news for the method – it supports eDNA as an index of fish numbers. We expect we’ll eventually be able to detect all local species – by collecting larger volumes, at additional sites in the estuary and at different depths.
In addition to local marine species, we also found locally rare or absent species in a few samples. Most were fish we eat – Nile tilapia, Atlantic salmon, European sea bass (“branzino”). We speculate these came from wastewater – even though the Hudson is cleaner, sewage contamination persists. If that is how the DNA got into the estuary in this case, then it might be possible to determine if a community is consuming protected species by testing its wastewater. The remaining exotics we found were freshwater species, surprisingly few given the large, daily freshwater inflows into the saltwater estuary from the Hudson watershed.
Analyzing the naked DNA
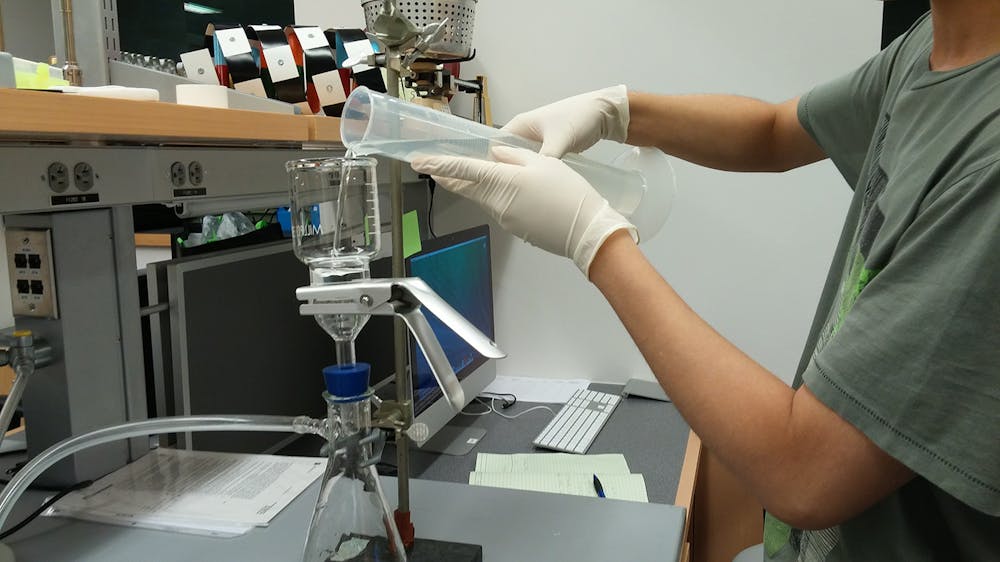
Our protocol uses methods and equipment standard in a molecular biology laboratory, and follows the same procedures used to analyze human microbiomes, for example.
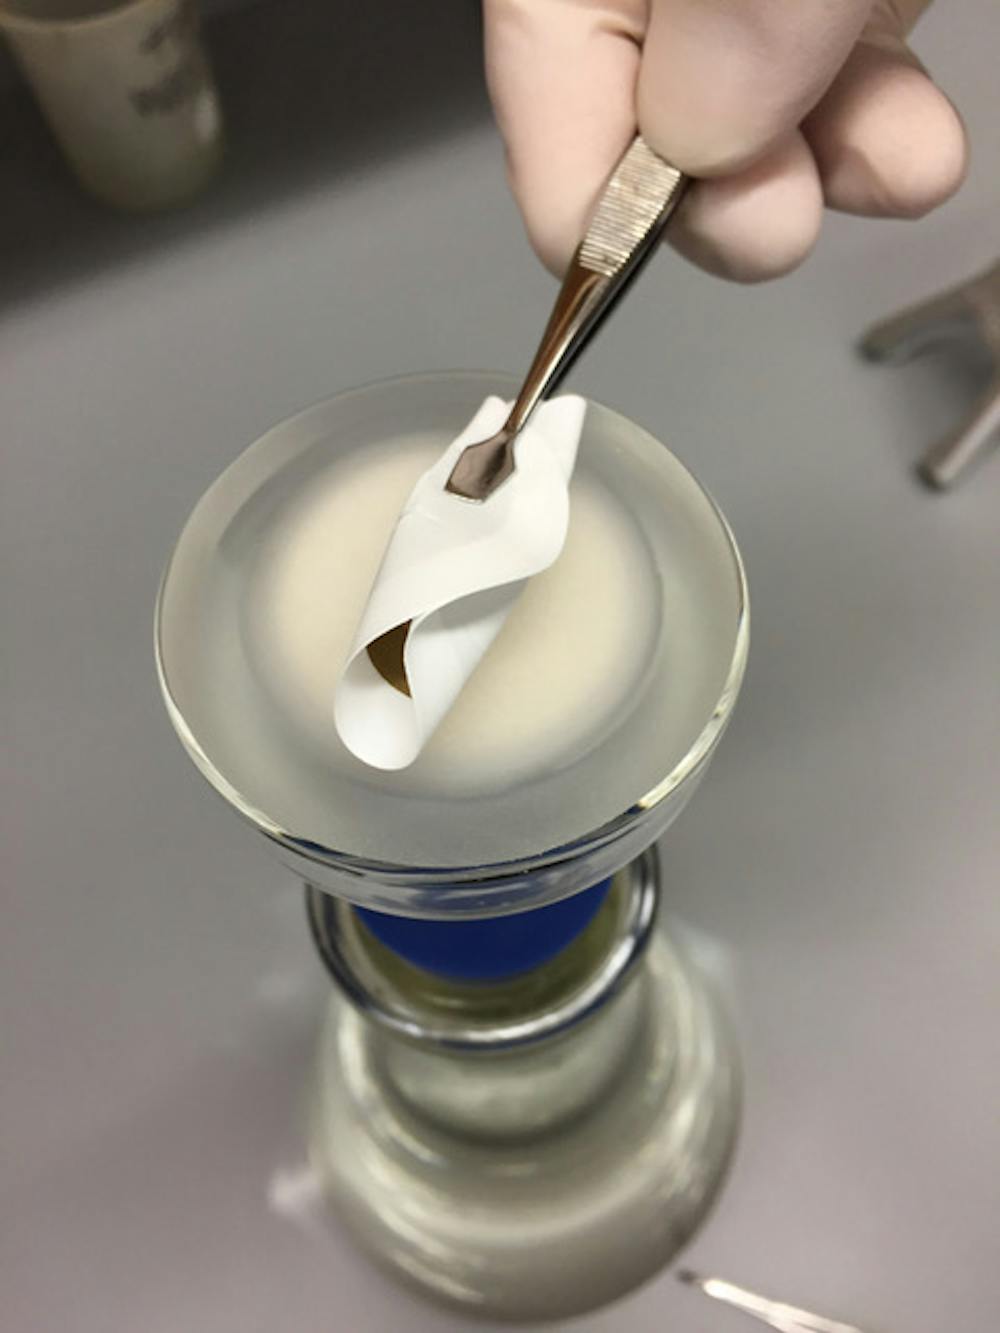
After collection, we run water samples through a small pore size (0.45 micron) filter that traps suspended material, including cells and cell fragments. We extract DNA from the filter, and amplify it using polymerase chain reaction (PCR). PCR is like “xeroxing” a particular DNA sequence, producing enough copies so that it can easily be analyzed.
We targeted mitochondrial DNA – the genetic material within the mitochondria, the organelle that generates the cell’s energy. Mitochondrial DNA is present in much higher concentrations than nuclear DNA, and so easier to detect. It also has regions that are the same in all vertebrates, which makes it easier for us to amplify multiple species.
We tagged each amplified sample, pooled the samples and sent them for next-generation sequencing. Rockefeller University scientist and co-author Zachary Charlop-Powers created the bioinformatic pipeline that assesses sequence quality and generates a list of the unique sequences and “read numbers” in each sample. That’s how many times we detected each unique sequence.
To identify species, each unique sequence is compared to those in the public database GenBank. Our results are consistent with read number being proportional to fish numbers, but more work is needed on the precise relationship of eDNA and fish abundance. For example, some fish may shed more DNA than others. The effects of fish mortality, water temperature, eggs and larval fish versus adult forms could also be at play.
Just like in television crime shows, eDNA identification relies on a comprehensive and accurate database. In a pilot study, we identified local species that were missing from the GenBank database, or had incomplete or mismatched sequences. To improve identifications, we sequenced 31 specimens representing 18 species from scientific collections at Monmouth University, and from bait stores and fish markets. This work was largely done by student researcher and co-author Lyubov Soboleva, a senior at John Bowne High School in New York City. We deposited these new sequences in GenBank, boosting the database’s coverage to about 80 percent of our local species.
We focused on fish and other vertebrates. Other research groups have applied an aquatic eDNA approach to invertebrates. In principle, the technique could assess the diversity of all animal, plant and microbial life in a particular habitat. In addition to detecting aquatic animals, eDNA reflects terrestrial animals in nearby watersheds. In our study, the commonest wild animal detected in New York City waters was the brown rat, a common urban denizen.
Future studies might employ autonomous vehicles to routinely sample remote and deep sites, helping us to better understand and manage the diversity of ocean life.